President Trump rejected Iran’s new proposal to open the Strait of Hormuz, resulting in the betting market (Polymarket) giving assigning only a 38% probability to the normalization of shipping traffic there by the end of May. The odds rose to 59% by the end of June.The price of U.S. crude and Brent rose, but this negative, at first glance, news did not prevent the S&P 500 and the Nasdaq from posting small gains, having recorded historic intraday highs.
Positive expectations regarding corporate earnings and perhaps a deal between the U.S. and Iran that would gradually normalize the oil market may explain the behavior of the stock markets. Whether they are right or not remains to be seen.
Reports that Iran is struggling to store the oil it produces—even mobilizing the supertanker NASHA, which had been decommissioned for many years, to gain 1–2 days—reinforce the impression of pressure.
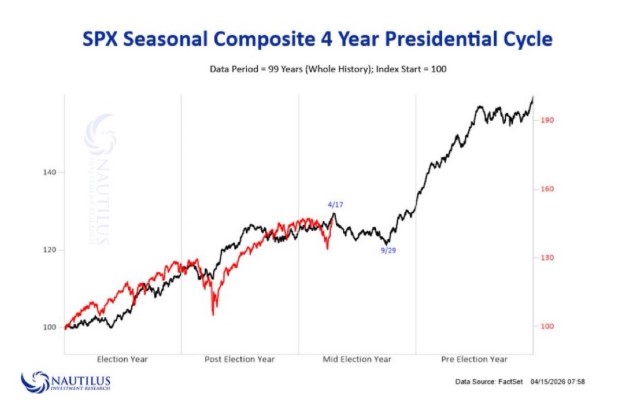
On the other hand, we should not overlook the historical behavior of U.S. stock indices during midterm election years for the Senate and House of Representatives, such as this November.
This is because these years are characterized by corrections in the S&P 500 index averaging 16%. Historical data show that 19 corrections occurred during midterm election years in 19 of the last 20 presidential cycles.
That’s the bad news, but there’s good news too. All U.S. stock market corrections have led to a new bull market. And in all 19 cases, we saw a repeat of the same phenomenon, with an average duration of two years, coinciding with the third and fourth years (election years) of the presidential cycles.
The message is clear, as the experts who observed this say. Panic during a correction is a poor advisor and is unwarranted. Buying stocks during a downturn, which lasts from 6 to 9 months, is justified because it has historically paid off.
Of course, history doesn’t exactly repeat itself, as they say. If we take a look at this year, one could argue that the correction has already taken place,as the S&P 500 index fell by 10% from its January high on March 30.
However, it took about 12 trading sessions in April to return to its highs and hit a new all-time high yesterday at 7,173.91 points, up 13%.
So, has the correction already taken place this year, or is this just the first part of the correction, with more to follow in the coming months?
It is difficult to say, as the geopolitical landscape is different this time. If, however, history is any guide, then stocks will correct once more this year, providing an opportunity to generate significant gains over the next two years in the U.S.