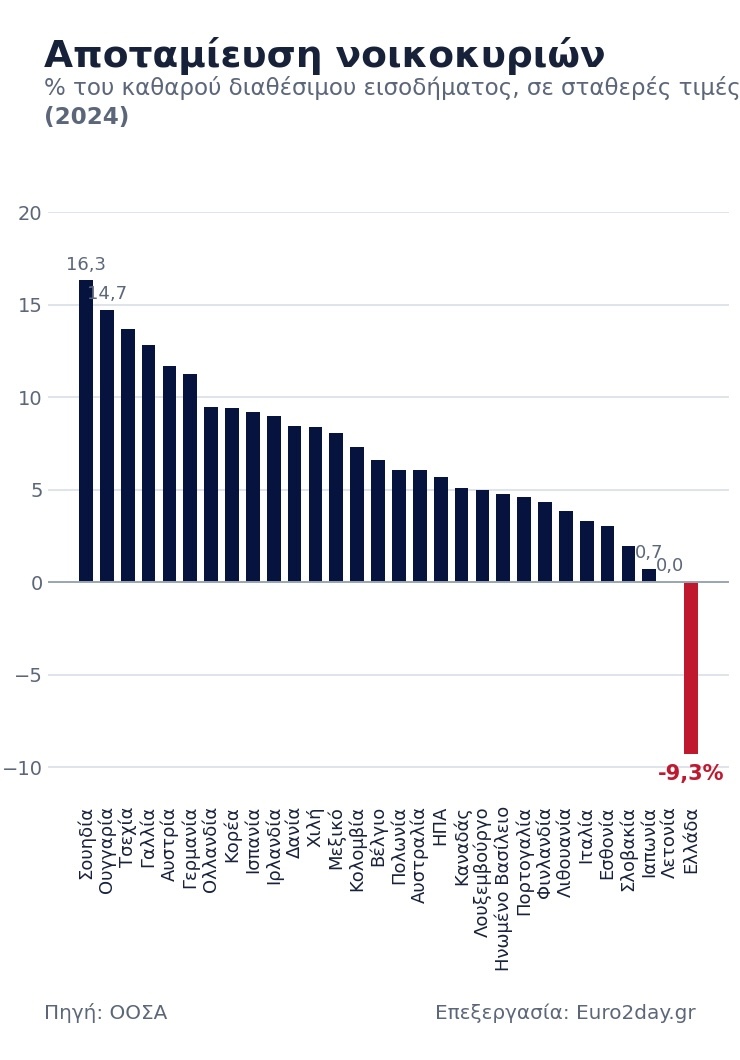
The financial reality of Greek households is becoming increasingly paradoxical. While data from the Bank of Greece show a steady increase in total deposit balances, Greece once again ranks last among OECD countries in terms of the savings rate.
This finding highlights a deep, structural weakness: Greeks, as a whole, are forced to “live hand-to-mouth,” as their real disposable income is insufficient to cover their current, net expenditures. The divergent trends between deposits and savings conceal a sharp inequality in the distribution of wealth.
Savings is one thing; deposits are another
It is crucial to understand that savings are not the same as deposits. Savings represent the flow: the portion of current income that is not consumed in a given period but is set aside. Deposits are the stock: the accumulated amount of money held in bank accounts.
The fact that the savings rate in Greece is negative means that the household sector’s net income falls short of its total expenditures. To cover this deficit, households are forced either to liquidate existing assets (such as withdrawing from previous savings) or to borrow.
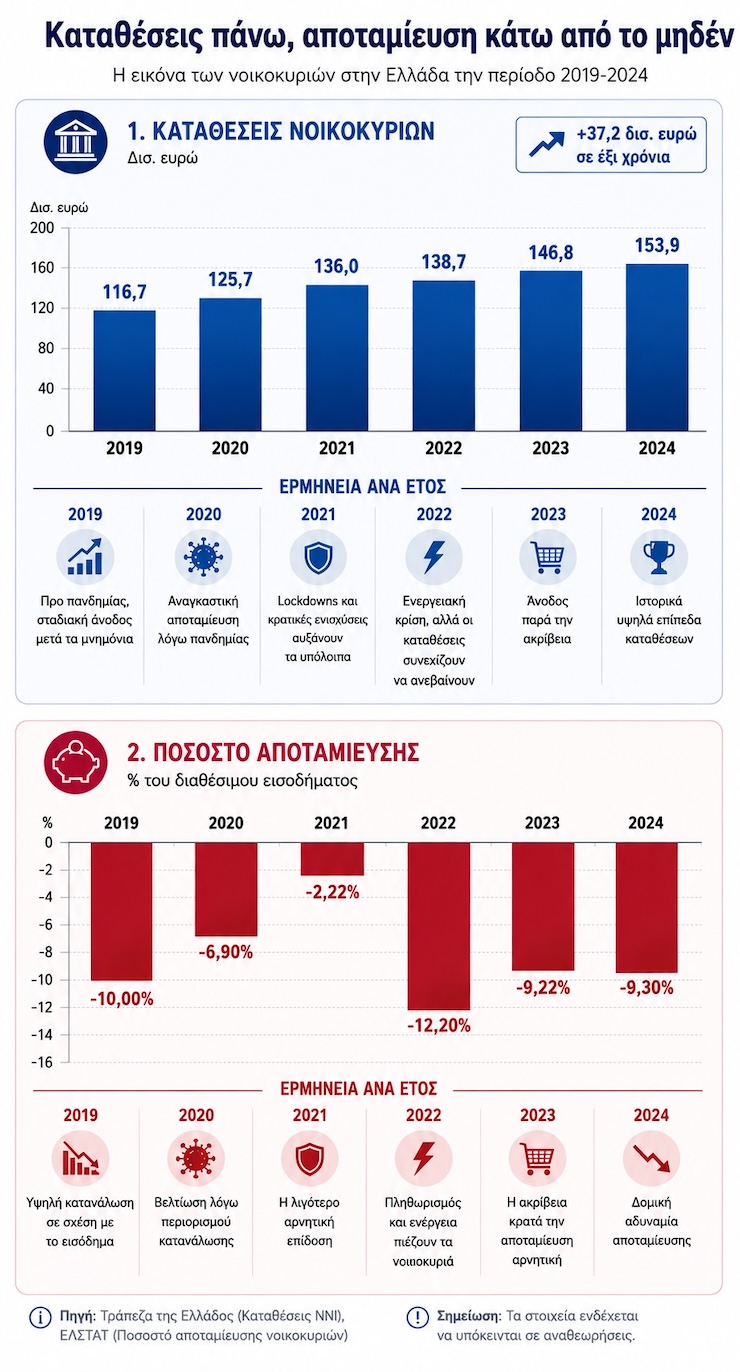
Increase in Deposits
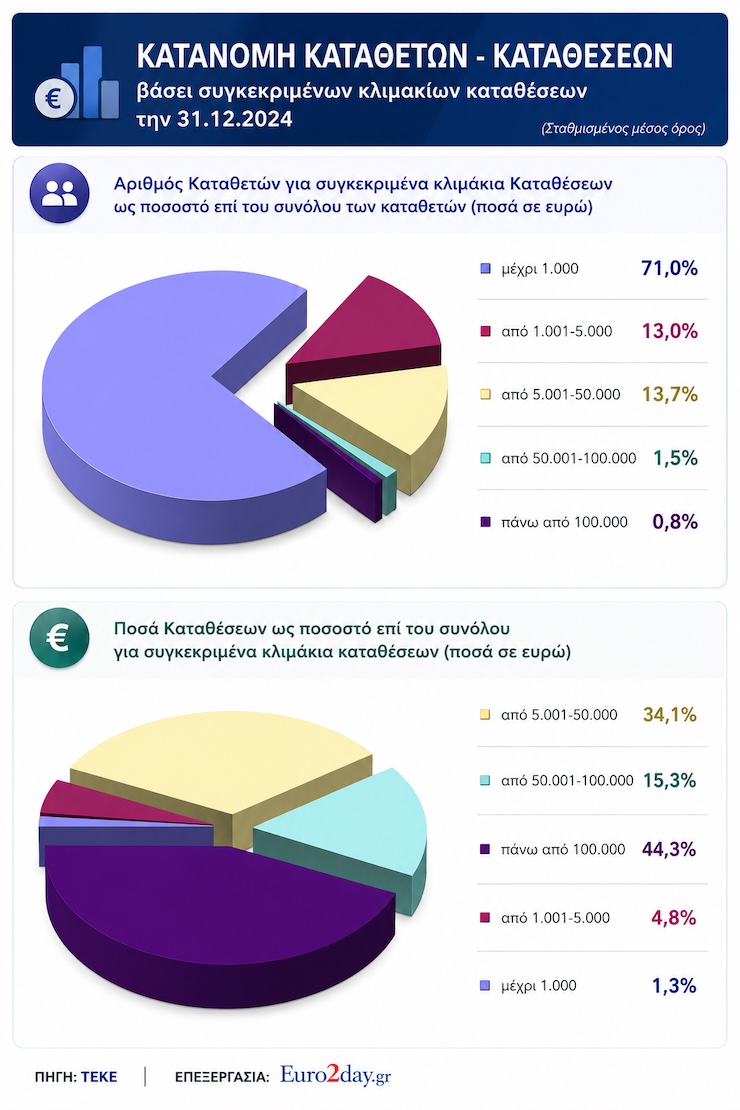
Data from the Deposit and Investment Guarantee Fund (TEKE) reveal an extreme concentration: the overwhelming majority of depositors, 71%, hold amounts under 1,000 euros in their accounts. This means that the majority of the population essentially has no “safety cushion.”
To understand how total deposits increase despite the negative savings of the many, a simple example suffices: If 7 small depositors each withdraw 1,000 euros, they reduce the total by 7,000 euros. However, if at the same time, just 3 wealthy depositors each save 3,000 euros, they increase the total by 9,000 euros.
The final result is a net increase in total deposits of 2,000 euros, despite the fact that the majority of people (7 out of 10) reduced their savings. The increase in the stock of deposits, therefore, is driven by a minority, while the majority is under pressure.
Inequality
A recent study by Eurobank and the Athens University of Economics and Business sheds light on these inequalities. The findings are revealing: 40% of the total volume of savings comes from just 1% of households with the highest incomes.
In contrast, families with two children show, on average, negative savings, a fact that highlights the high cost of living and the pressure faced by middle-income earners. It is also interesting to note that retirees save at twice the rate of wage earners, perhaps reflecting different consumption patterns and uncertainty about the future.
A long-standing problem
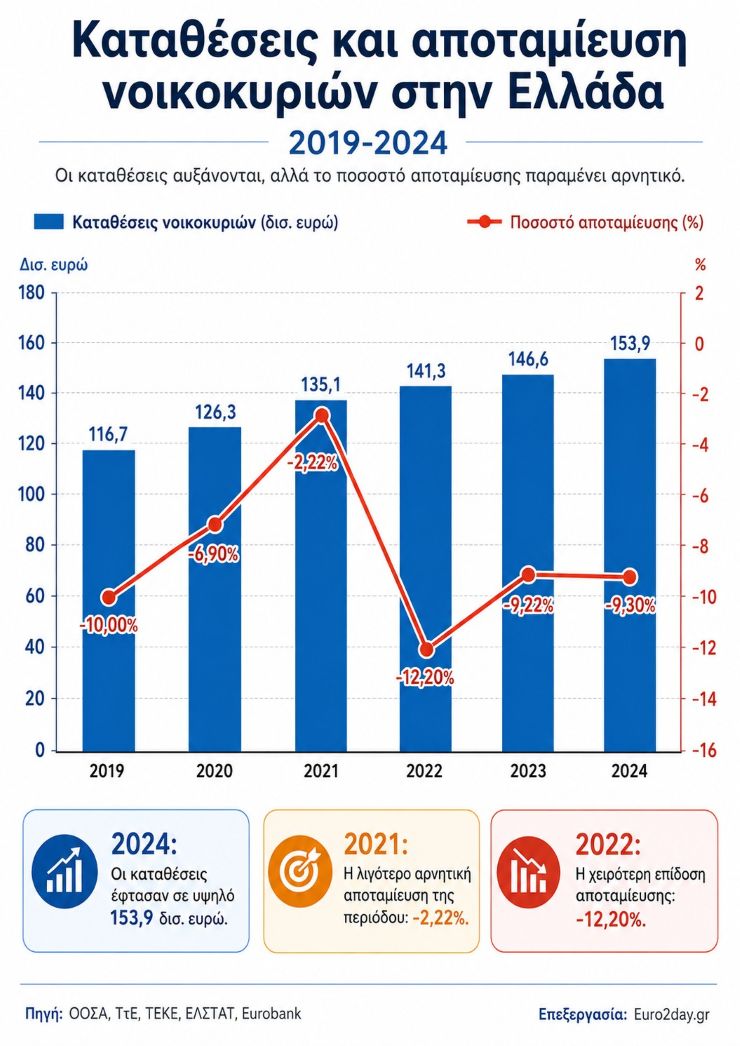
Negative net savings is not a new phenomenon for Greece. The factors driving it have been consistently observed for the past 17 years. It is telling that this trend persisted even during the pandemic. Despite the fact that deposits surged at that time—due to mandatory restrictions on consumption and government aid—the structural characteristics of low/declining savings remained in place.
This ongoing situation undermines the prospects of the Greek economy, as it reduces the domestic resources available for investment and makes households more vulnerable to future economic crises.
| Net household savings in the OECD |
| As a percentage of net disposable income |
| Country | 2018 | 2019 | 2020 | 2021 | 2022 | 2023 | 2024 |
| Sweden | 12.51 | 14.52 | 15.01 | 14.99 | 13.08 | 14.37 | 16.32 |
| Hungary | 11.00 | 11.97 | 11.96 | 13.89 | 11.30 | 16.21 | 14.72 |
| Czech Republic | 5.52 | 5.71 | 12.52 | 12.96 | 11.49 | 14.47 | 13.68 |
| France | 8.25 | 8.88 | 14.84 | 13.25 | 10.70 | 11.20 | 12.80 |
| Austria | 7.74 | 7.21 | 13.55 | 11.35 | 9.06 | 8.63 | 11.66 |
| Germany | 10.98 | 10.49 | 16.03 | 14.21 | 10.26 | 10.40 | 11.25 |
| Netherlands | 6.82 | 9.22 | 15.59 | 12.25 | 7.20 | 7.77 | 9.46 |
| Korea | 5.37 | 6.76 | 13.38 | 10.80 | 7.43 | 7.32 | 9.43 |
| Spain | 2.48 | 5.11 | 14.31 | 10.80 | 4.99 | 7.98 | 9.22 |
| Ireland | 7.98 | 9.48 | 22.20 | 17.50 | 10.02 | 6.87 | 8.97 |
| Eurozone | 6.01 | 6.50 | 13.18 | 10.69 | 6.32 | 7.13 | 8.29 |
| EU | 5.42 | 6.07 | 12.39 | 10.02 | 6.03 | 6.99 | 8.12 |
| Greece | -15.88 | -10.00 | -6.90 | -2.22 | -12.20 | -9.22 | -9.30 |
| Note: Some countries did not have data available for 2024. |
Source: OECD
Edited by: Euro2day.gr |