A shift in power between an established and a rising power does not necessarily lead to war, but it widens the range of possible outcomes. After almost 18 years of an upward trend, markets appear to be pricing in only one side of the coin.
A review of the October 2026 data partly confirms this picture and highlights an important point: gold is not rising at the moment.
In Book One of his “History” (1.23.6), Thucydides distinguishes the immediate causes of the Peloponnesian War — Epidamnus, Corcyra and Potidaea — from its true cause: the growth of Athenian power and the fear it caused in Sparta, which compelled it to fight. Athens was the rising power; Sparta the established one.
Thucydides himself set out this framework. Graham Allison coined the term “Thucydides trap” and applied it to the present-day US-China relationship: of the 16 power transitions over the past 500 years, 12 ended in war.
Volatility and risks
We believe this “12 out of 16” figure should be treated with caution. The sample is small, the definitions are flexible, and the statistics do not establish causation. The four cases that did not lead to war, including the Cold War, show that conflict is not inevitable. For an investor, however, the useful takeaway is different: power transitions are periods of heightened uncertainty across the board, and certainly in the markets.
In market terms, what matters is the spread of outcomes, not the average. In stable times, the “curve is narrow and tall”: most outcomes cluster around the average. When uncertainty rises, the curve spreads out.
As the spread (standard deviation) widens — that is, as outcomes move further from what is “expected” — the average may stay the same, but the range of possibilities grows. At the same time, the two ends of the curve contain extreme and rare events: crashes, war, blockades. In a normal distribution, their probability is effectively zero.
But when the tails are “fat”, extreme events occur far more often than a normal probability distribution would predict. In markets, this is the rule. In effect, when the balance of power shifts, the range of possible outcomes widens and extreme scenarios become more likely: more miscalculations, more regional flashpoints, proxy wars, economic warfare, cyberattacks and blockades.
Thucydides had already shown this in Corcyra: war begins with secondary disputes, which are magnified by alliances and fear.
Nuclear weapons reduce the likelihood of direct conflict between the great powers, and this is the strongest argument in favour of deterrence. But the stability-instability paradox holds that the more stable the balance at the top, the more tolerable lower-intensity conflicts become.
That is where the risk lies — one markets tend to underestimate: few events, major impact.
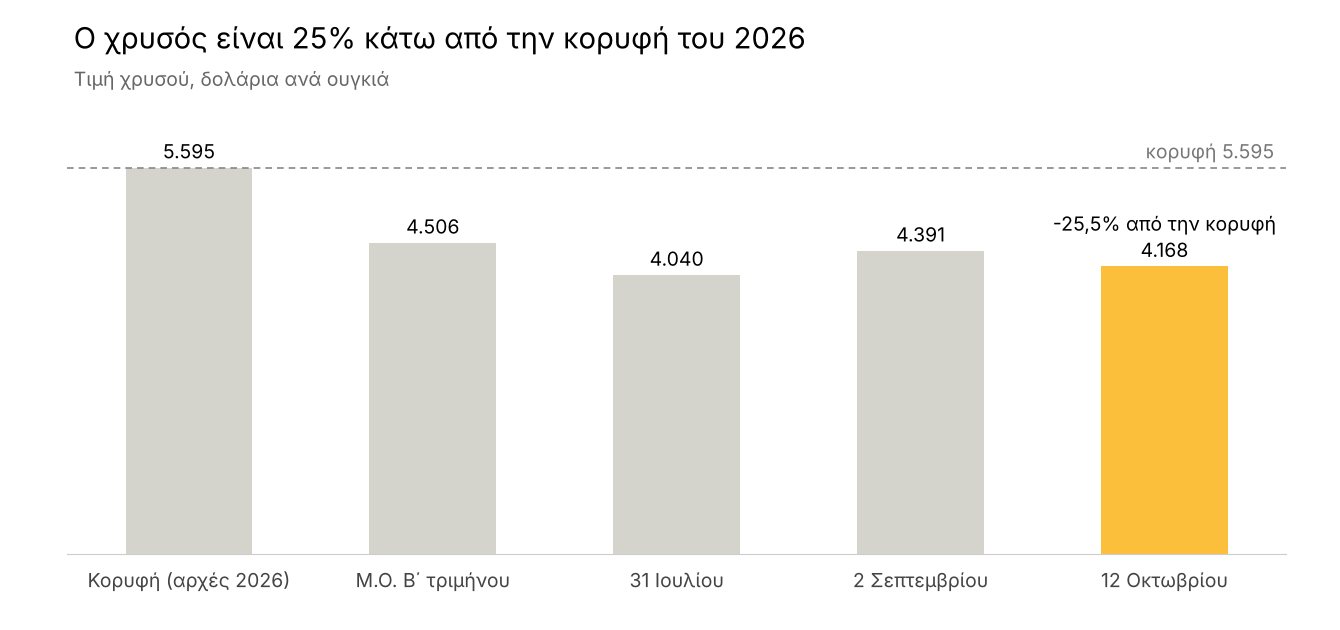
The basic starting assumption is that gold is rising and central banks are buying it because they have a better read on risks. A review corrects the first part of that assumption. Gold broke above $5,000 in early 2026, reached $5,595 and lost almost $1,200 in two days, its worst two-day fall since 1983.
On 12 October, it closed at around $4,170, about 25% below its peak. The World Gold Council links western demand through ETFs to real interest rates, monetary policy expectations and the dollar, while the US 10-year Treasury yield is close to 5.25%. Gold is not currently confirming that markets are fearful.
The second part holds up, with caveats. According to the World Gold Council, central banks bought 289 tonnes in the second quarter, a record for a second quarter and 62% more than a year earlier, while first-quarter purchases were revised down from 244 to just 57 tonnes. The WGC’s latest monthly data show net purchases of 39 tonnes in August and 170 tonnes in the first eight months.
China bought 20 tonnes, its 22nd consecutive month of purchases, while Poland has bought 98 tonnes since the start of the year. Turkey has been a net seller of 82 tonnes and Russia of 56 tonnes. The monthly data cover reported purchases only and are not directly comparable with the quarterly figures. The WGC expects central banks to remain significant buyers, at a slightly slower pace than over the past four years.
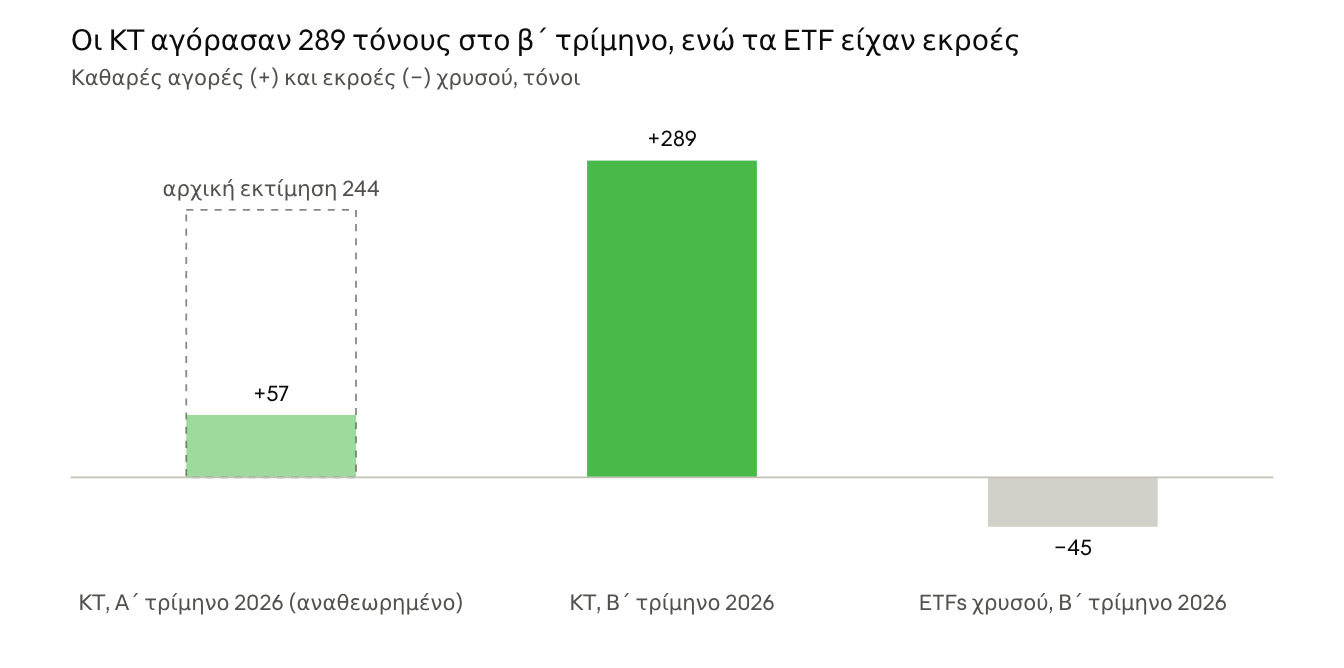
Source: World Gold Council, Gold Demand Trends Q2 2026 (30 July 2026).
The most interesting feature is the divergence: while central banks were buying, gold ETFs saw outflows of 45 tonnes. Institutional investors are building reserves, while western investors are not following suit. This is consistent with our view that private investors are complacent, but it does not show where they have turned instead.
On 12 October, the S&P 500 closed at 7,807.24 points and the VIX at 15.21, while the Nasdaq fell 0.44% amid pressure on memory and artificial intelligence stocks.
The previous week, however, was not quiet. On Thursday, 8 October, Brent rose 4.1% to $104 amid concerns about supply from the Middle East, and the Nasdaq fell 1.25% after conflicting estimates of OpenAI revenue. The VIX moved only from 15.08 to 15.41 that day.
On Friday, the S&P 500 closed at 7,811.54 points (+0.6%), after President Trump said the US would not attack Iran before the November midterm elections, and on Monday Brent rose a further 1.8% to $106.65. At the same time, September job creation was just 29,000 and the University of Michigan consumer sentiment index fell to 46.3, a multi-decade low.
In other words, US consumers are deeply pessimistic. The US 10-year Treasury yield is around 5.20-5.35%.
Since its March 2009 low, the S&P 500 has risen more than 11-fold. A run like that teaches investors to buy every dip — and that is what we mean by two decades of habit. A VIX at 15.21 is not a record low, but it is low enough for an environment with Brent above $100 and the 10-year yield above 5%.
The clearest signals are in the credit market. The spread on US high-yield bonds — the additional yield over US government bonds of the same maturity — was close to 270 basis points (2.70%) in July, at the fourth percentile of its historical range, with a default rate of 2.0%.
The latest reading of the ICE BofA index, on 8 October, puts it at 3.15% — slightly wider, but still in the lower half of the 2.59%-4.61% range since January 2025.
A market paying a minimal credit risk premium when the risk-free rate is above 5% has little room for error.
Power transitions always increase volatility and the likelihood of multiple conflict flashpoints, and markets are pricing in that possibility with a low premium. Gold, however, is not currently signalling a rise. It signals diversification of institutional reserves — and unevenly so.
The view that markets are underestimating the risks at this particular time remains a judgement, not a proven fact, since there is no clear indicator for such events. The coin has two sides: if volatility rises, “protection” will cost more when it is needed than it does now, when the market is offering it cheaply.
* Director of Research at Solidus Securities AEPEY, leading portfolio analysis and asset allocation optimisation, and developing integrated financial models to assess risk and forecast market trends. President of EEAPMA - HACSA.