On the weekly chart, the General Index of the Athens Stock Exchange is forming three consecutive bearish divergences with the RSI(14), in overbought territory. The index is making higher peaks while the RSI is making lower ones. The pattern has been developing for about a year.
We believe this is an early indication of a correction. The trend remains upward, but its underlying momentum has weakened, and prices are now moving with less “energy” than they were a year ago.
The index closed yesterday at 2,530.46 points, down 2.22%, after falling 2.11% on Thursday to 2,587.93. It lost 4.2% in two sessions and 3.2% over the week, and is at its lowest level since late July. At yesterday’s close, the RSI on the weekly chart stood at 51.87, below its moving average (65.68).
In our view, there are three reasons for the bearish tone in markets on Thursday: the French bond yield rising above 5%, the rise in CDS and the realisation, following Meta’s results in the US, that such high capex leads to negative FCF.
Together with higher yields, this is driving a re-rating towards lower valuations in the world’s most important sector, technology. On Friday, pressure was compounded by Brent above $116 a barrel and Bank of Greece data showing non-performing loans at €6.2bn, up 9.3% from December.
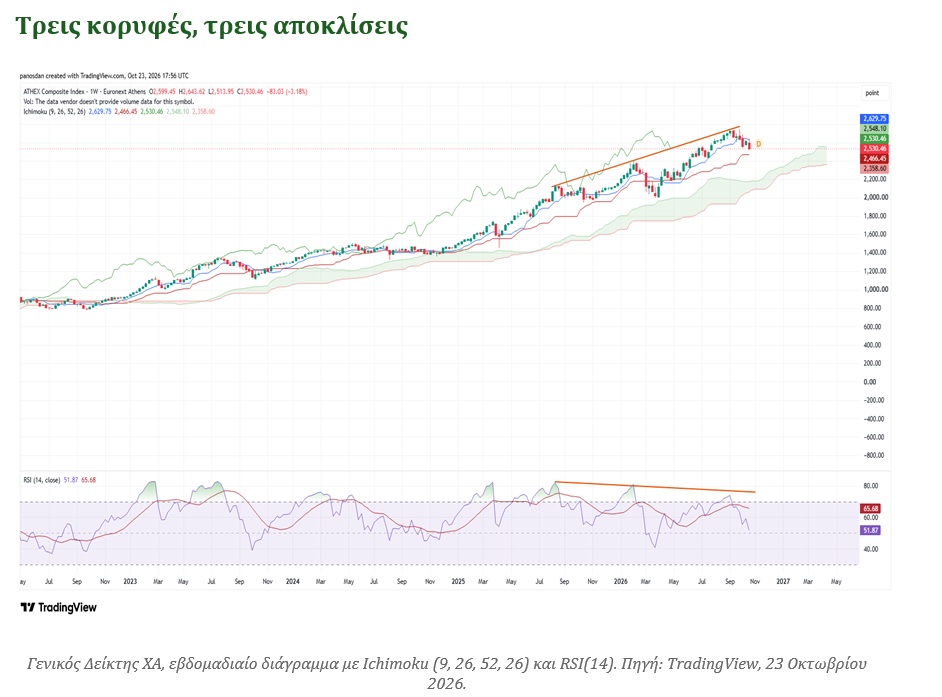
The index’s first peak, near 2,130 points in August 2025, was accompanied by an RSI of around 83. The second, near 2,400 points in early 2026, came with an RSI of around 81. The third, near 2,750 points in September, reached only around 75.
Each time, the price made a higher peak and the RSI a lower one. Most concerning is that momentum failed to confirm even the latest peak, although the index had reached its highest levels of the period. The recovery from lows of 2,000 points in spring 2026 came with progressively less underlying strength.
After the third peak, the RSI fell to 51.87 (weekly chart, close on 23 October) and is below its moving average. Momentum has already started to turn, and yesterday’s session confirmed the shift: the index fell 2.22% and closed in the bottom quarter of its daily range (high 2,578.84, low 2,513.95).
The banking index fell 4.52% to close at 2,832.50 points, marking a second consecutive session with losses of more than 4% (Thursday: −4.38%). National Bank of Greece (−5.5%), Piraeus (−5.2%), Alpha Bank (−4.2%) and Eurobank (−4.0%) led the declines.
Turnover was about €764m, of which around €304m came from block trades, mainly in Eurobank (€247m), compared with €331m on Thursday, when 80 shares closed lower and 37 higher.
The Ichimoku cloud: trend still upward, momentum fading
On the weekly Ichimoku chart, the index remains well above the cloud, which is roughly in the 2,000–2,100-point area. The long-term trend, therefore, has not changed. What is changing is the short-term picture.
The index closed at 2,530.46 points, 3.8% below the conversion line (Tenkan-sen) at 2,629.75. For many months, the price had held above it, and its loss indicates that momentum is weakening. The next significant support is the baseline (Kijun-sen) at 2,466.45, 2.5% lower and just above the 2,430–2,450 area we are watching.
The cloud projected 26 weeks ahead has boundaries at 2,358.60 and 2,548.10 points. Its upper edge is close to our first support level, and today’s close is already 0.7% below it. This makes the 2,360–2,550 area the zone where the correction and its character will be determined.
What is driving the pressure
The technical picture also has a fundamental explanation. Three factors are converging:
- France. The French bond yield is rising above 5%, increasing the discount rate across the European market and the cost of capital.
- CDS. Rising CDS on the sovereign bonds of several eurozone countries and the M -7 indicate that credit risk is being priced more expensively, and investors are demanding a higher premium to hold risk.
- Capex and FCF. Meta’s results made clear that such high capex leads to negative FCF.
As we have shown in previous articles, negative FCF combined with higher yields leads to a re-rating towards lower valuations. We believe this explains why the shift in momentum visible on the charts could turn into a more substantial correction, and why banks came under heavier pressure today.
Why a divergence in overbought territory matters
The RSI measures the speed and magnitude of upward moves relative to downward ones. When the price makes new highs but the RSI does not, it means the rally is being supported by fewer and fewer buyers, and that each new peak “costs” more in terms of momentum.
Three things strengthen the signal. First, the divergence appears on a weekly chart, which carries more weight than a daily one. Second, it has occurred three times and is not an isolated event. Third, it has appeared in overbought territory, above 70, where corrections are more common and sharper.
However, caution is needed. The divergence is a warning of a “serious” correction, not a timing tool. The index continued to rise for a year, from 2,130 to around 2,750 points, a gain of more than 29%. The signal’s significance is that it raises the risk at elevated levels, not that it indicates the duration and depth of the correction.
Levels we are watching| Level (points) | Role | Distance from close |
|---|
| 2,750 | Resistance, third peak | +8.7% |
| 2,630 | Ichimoku conversion line (Tenkan), resistance | +3.9% |
| 2,525–2,530 | First support, recent low | −0.2% |
| 2,466 | Ichimoku baseline (Kijun) | −2.5% |
| 2,430–2,450 | Second support, summer lows | −3.6% |
| 2,000 | Critical support, spring low | −21.0% |
Distances are approximate and calculated from the 23 October close of 2,530.46 points.
The first support level, tested during the previous decline, was also tested intraday today (low 2,513.95), and the index closed essentially on it. The second is the level that, in our view, will determine whether the correction remains mild or deepens. The weekly close at 2,530 is above the Kijun and below the Tenkan.
Scenarios and what would invalidate the signal
Our base case is a correction towards the 2,430–2,450-point area, around 3–4% below the current level and about 11% below the peak (the index is already 8% below the peak).
In previous corrections, the RSI fell towards the 40–50 zone, which would represent a normal “cooling-off” of overbought conditions. At 51.87, the RSI is already close to that range.
The Ichimoku baseline (2,466 points) lies just above this area, and a weekly close below it would confirm the correction. This week’s close (2,530) is still above it.
If the 2,430-point area is breached on a weekly closing basis, the way would be open for a deeper correction towards 2,000. We do not consider this the most likely outcome, but it is the so-called risk scenario.
The signal would be invalidated if the index closes above 2,750 points on a weekly basis and the RSI simultaneously breaks above its descending line of peaks, near 78. Momentum would then confirm the price, and the divergence would no longer hold.
Taking into account the limitations of Technical Analysis, we can conclude that the General Index’s technical picture remains upward in the medium-term trend, but momentum is fragile. Three consecutive bearish divergences in overbought territory on a weekly chart are a signal that cannot be ignored, and the 4.2% fall in two sessions confirms it.
We believe this favours profit-taking during up sessions and greater caution at current levels, with 2,430–2,450 points as the key area to watch. The factors we have described—yields, CDS and the issue of capex and FCF—are moving in the same direction as the technical signal.
The divergence does not predict when the turn will come. It warns that risk at elevated levels has increased, and that alone is enough to prompt a reassessment of position sizes.
* The analysis is based on the General Index’s weekly chart (Ichimoku and RSI), using the weekly close on 23 October 2026, at 2,530.46 points.
** Director of Research at Solidus Securities AEPEY, overseeing portfolio analysis and asset allocation optimisation, and developing integrated financial models to assess risk and forecast market trends. Chairman of ΕΕΠΑΜΑ - HACSA.
*** This article is for informational and educational purposes and does not constitute investment, tax or legal advice. The figures are indicative, based on publicly available historical data, and do not guarantee future returns. Before making any investment decision, consult a certified investment adviser.