All four banks delivered a strong nine-month performance, with higher profits and fee income, as well as strong loan growth.
The differences lie in the quality and momentum of earnings. Eurobank has the highest return (RoTBV 16.9%) and high-quality assets. National Bank has the strongest capital position (CET1 17.5%) and the highest NPE coverage (103%), but its profits rose by just 2%, as expenses (+8%) outpaced revenue (+3%).
Piraeus is the most cost-efficient systemic bank, with a cost-to-income ratio of 33% and the highest share of fees in revenue, but it has the lowest capital adequacy and its earnings momentum slowed in the quarter. Alpha Bank has the strongest growth and earnings momentum in the quarter, but the weakest asset-quality profile.
Key figures for the first nine months of 2026
| Metric | Eurobank | Alpha Bank | Piraeus | National Bank |
|---|
| Reported profits | 1,161 (+12.4%) | 766 (+8.4%) | 893 (+9%) | 888 (+0.3%) |
| Adjusted profits | 1,209 (+14.3%) | 779 (+14.2%) | 908 (+5%) | 996 (+2%) |
| Earnings per share | €0.31 (€0.28) | €0.31 | €0.68 (+10%) | €1.48 adjusted, annualised (+6%) |
| Net interest income (NII) | 2,068 (+8.7%) | 1,325 (+10.7%) | 1,532 | 1,683 (+5%) |
| Fees / services | 630 (+13.0%) | 483 (+32.2%) | 679 (+39%) | 371 (+10%) |
| Core revenue (NII + fees) | 2,698 (+9.7%) | 1,808 (+15.7%) | 2,211 (+15%) | 2,054 (+6%) |
| Total revenue | 2,776 (+10.8%) | 1,848 (+13.5%) | 2,179 (+10%) | 2,151 (+3%) |
| Operating expenses | 995 (+6.9%) | 702 (+12.7%) | 722 | 741 (+8%) |
| Cost-to-income ratio | 35.8% | 37.8% | 33% | 34.4% |
| Net interest margin (NIM) | 2.49% | 2.2% | 2.2% | 2.79% (2.88% in Q3) |
| Cost of risk | 53 bps | 42 bps | 57 bps | 38 bps |
| NPE ratio | 2.4% | 3.8% | 2.0% | 2.4% |
| NPE coverage | 81.9% | 52% (128% including collateral) | 58% | 103% |
| RoTBV | 16.9% | 14.5% | 15.4% | 15.7% (RoTE) |
| CET1 | 15.5% (14.3% pro forma) | 14.5% | 12.9% | 17.5% (after distribution) |
| Total capital ratio | 20.4% | 19.3% | 18.6% | 21.2% |
| Loans | €59.1bn gross, organic growth +10.5% | €40.4bn performing, +13.1% | €39.6bn performing, +8% | €39.2bn performing, +13% |
| Deposits | €87.2bn (+10.6%) | €59.9bn (+13.3%) | €69.2bn (+9%) | €62.3bn (+7%) |
| Loans to deposits | 66.4% | 77% | 65% | 67% |
| Assets under management | €11.4bn (+22.3%) | €28.2bn (+32%) | €16.9bn (+19%) | n/a |
Profitability and efficiency
Figures in the table are in €m unless otherwise stated. Piraeus's core and total revenue are not disclosed in its results statement and are calculated by adding published figures.
Eurobank delivers the highest return (RoTBV 16.9%), with a high net interest margin (2.49%). Its performance is supported by expenses growing more slowly than revenue: revenue rose 10.8% and expenses 6.9%, while provisions fell 5.5%.
National Bank follows, with RoTE of 15.7% and a cost-to-income ratio of 34.4%, but recorded the weakest profit growth: 2% before one-off items (€996m) and 0.3% attributable to shareholders (€888m). Revenue rose 3% and expenses 8%, while income from financial transactions fell 35% to €97m from €150m.
National Bank's net interest margin was 2.79% for the first nine months (2.88% in Q3), the highest of the four. Alpha Bank increased revenue by 13.5%, but expenses also rose 12.7%, leaving its cost-to-income ratio at 38%, the highest of the four, although it fell to 36% in the quarter. Piraeus has the lowest cost ratio (33%, and 32% in Q3).
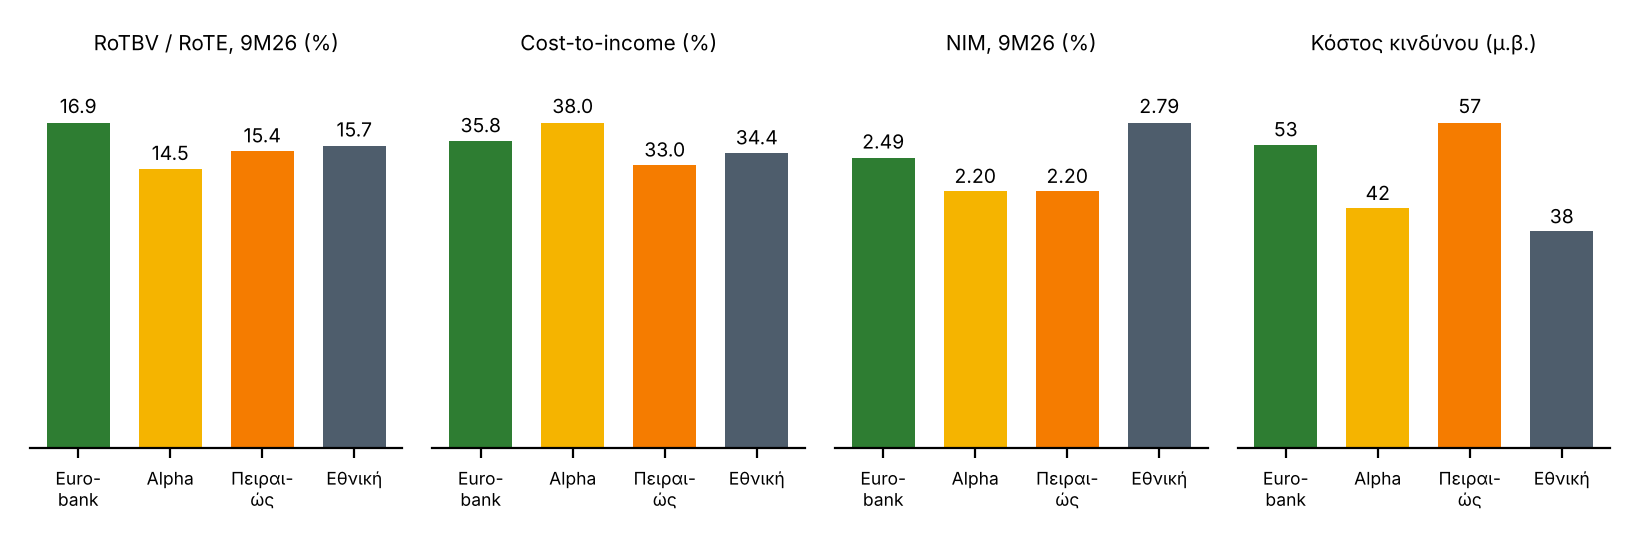
National Bank has the lowest cost of risk (38 bps, within its target of below 40 bps), alongside strong NPE coverage. Alpha's cost of risk is also low, at 42 bps, but this comes alongside weak asset quality and management's warning that it will review its provisioning models in Q4. For this reason, we do not regard it as an advantage.
Revenue quality and quarterly momentum
Fees now make a meaningful contribution at all four banks: 23% of total revenue at Eurobank, 26% at Alpha, 31% of total revenue at Piraeus and 17% of total revenue at National Bank. But fee growth has not been uniform.
At Piraeus, the increase is driven by Ethniki Insurance; at Alpha, by acquisitions and the €40m dividend from Prodea received in Q2; and at Eurobank, by lending, wealth management and insurance activities. At National Bank, fees rose 10% to €371m, supported by mutual funds, which grew by more than 40%, but were almost flat in Q3 at €128m, compared with €129m in Q2.
All four banks benefited from the rise in ECB interest rates in terms of net interest income, with Q3 up from Q2 by 5% at Eurobank, 8% at Alpha, 7% at Piraeus and 6% at National Bank (€587m, with the margin at 2.88%, up from 2.73%). This is a cyclical tailwind, not a structural one: should the trend reverse, a subsequent interest-rate cut would reverse that boost.
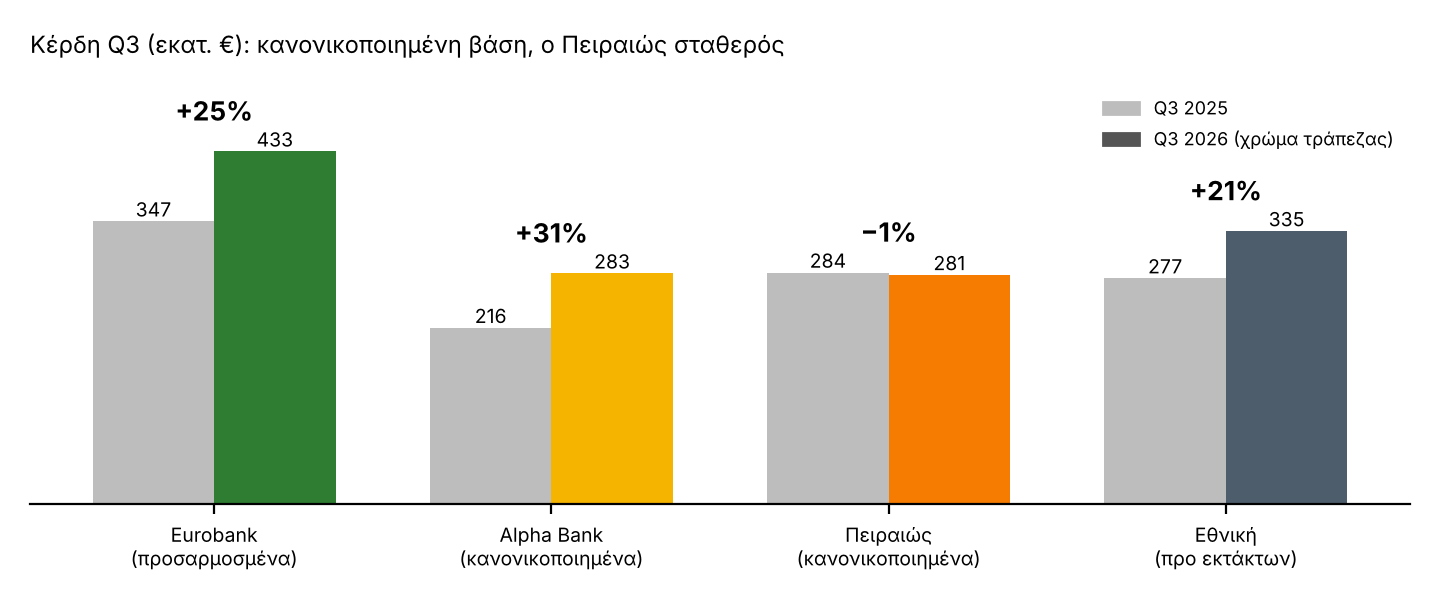
Piraeus showed signs of weakening in the quarter. Net profit rose 5% year on year (€261m to €275m), but fell 1% on an adjusted basis (€284m to €281m) and 17% quarter on quarter (€340m to €281m).
Quarterly underlying operating profit of €301m rose 10% year on year, but fell 6% quarter on quarter, while quarterly RoTBV of 13.7% was below the nine-month figure of 15.4%.
To meet its €0.90 per-share target, it needs to earn €0.22 in Q4, slightly more than the €0.21 in Q3. This is achievable, but leaves little room for disappointment.
National Bank, by contrast, accelerated: pre-exceptional profits reached €335m in Q3, up 6% from Q2 and about 21% year on year.
Asset quality
Eurobank and Piraeus reduced their NPE ratios to 2.4% and 2.0%, respectively, while Alpha's rose to 3.8% from 3.6% at the half-year, with coverage falling to 52% from 55%.
Piraeus achieved the reduction through portfolio sales, which is why its coverage fell from 67% to 58% in a single quarter, as portfolios with high coverage were sold.
Eurobank covers almost 82% of its NPEs. National Bank kept its NPE ratio unchanged at 2.4% in the quarter, with coverage of 103% (105% in Q2), the highest of the four, while coverage of Stage 3 loans fell to about 53% from 55%.
Coverage definitions differ from bank to bank, so the figures are not entirely comparable, but the direction is clear.
Eurobank also flagged a risk for Q4: the possible reclassification of loans under the law on Swiss franc loans could raise its NPE ratio by about 40 bps and reduce coverage by about 10 percentage points.
Capital, growth and liquidity
National Bank has the strongest capital position (CET1 of 17.5% after providing for a 60% payout of profits, with a surplus of about €2bn above its internal target).
Its ratio is about 150 bps lower year on year, reflecting distributions, buybacks and changes in risk-weighted assets, and the bank announced an interim dividend of €230m (about €0.26 per share).
Eurobank follows, with CET1 of 15.5%, falling to 14.3% after the Eurolife deal, but still above Alpha's 14.5% after its dividend provisions and Piraeus's 12.9%.
Piraeus is targeting CET1 of more than 13% by the end of 2026 and has committed 57% of profits to distributions (about €650m), limiting its flexibility. Alpha has committed 55% (€421m) while also funding several acquisitions (Astrobank, AXIA, Alpha Trust, Flexfin, Universal Life/Altius).
Alpha leads on growth, with performing loans up 13.1% and deposits up 13.3% year on year. Eurobank follows (+10.5% organic loan growth, deposits +10.6%), then National Bank (loans +13%, but deposits only +7%) and Piraeus (+8% and +9%).
Alpha also has the highest loans-to-deposits ratio, at 77%, compared with 66% at Eurobank, 67% at National Bank and 65% at Piraeus, leaving it less scope to fund further growth from excess liquidity.
At National Bank, lending growth slowed in Q3, with net loan growth of about €0.1bn. Its target of more than €3bn in 2026 requires growth of more than €0.8bn in Q4.
Valuation
At closing prices on 4 November, the four banks trade within a narrow P/E range (10.8x to 11.5x), but show a wider spread in P/TBV (1.35x to 1.75x).
National Bank and Eurobank have the highest P/TBV ratios, at 1.75x and 1.74x, alongside RoTBV of 15.7% and 16.9%, respectively.
Alpha has the lowest P/TBV (1.35x) and the lowest RoTBV (14.5%), while Piraeus is in the middle (1.62x, with RoTBV of 15.4%).
EPS is based on annualised nine-month earnings (×4/3): it is underlying for Eurobank and Alpha, adjusted for National Bank and reported for Piraeus, so the P/E comparison is indicative.
For Alpha, TBV per share (€3.52) is taken from its results statement, while the interim dividend (€0.0553 per share, €124.2m in total) is from the board announcement of 30 September 2026. Yields refer only to the interim dividend, not the full-year distribution.
| Metric | Eurobank | Alpha Bank | Piraeus | National Bank |
|---|
| Price on 4/11 (€) | 4.602 | 4.736 | 9.824 | 16.60 |
| Annualised EPS (€) | 0.41 | 0.41 | 0.91 | 1.48 |
| P/E | 11.1x | 11.5x | 10.8x | 11.2x |
| TBV per share (€) | 2.65 | 3.52 | 6.07 | 9.5 |
| P/TBV | 1.74x | 1.35x | 1.62x | 1.75x |
| RoTBV (underlying) | 16.9% | 14.5% | 15.4% | 15.7% |
| Interim dividend (€) | 0.0599 | 0.0553 | 0.10 | 0.26 |
| Interim dividend yield | 1.3% | 1.2% | 1.0% | 1.6% |
| Nine-month payout | n/a | 55% | 57% | 60% |
Assessment
| Criterion | Eurobank | Alpha Bank | Piraeus | National Bank | Brief rationale |
|---|
| Return (RoTBV) | 1st | 4th | 3rd | 2nd | 16.9% / 14.5% / 15.4% / 15.7% (RoTE) |
| Cost efficiency | 3rd | 4th | 1st | 2nd | Cost-to-income ratio 35.8% / 37.8% / 33% / 34.4% |
| Asset quality | 2nd | 4th | 3rd | 1st | Alpha has NPEs of 3.8% and a rising trend; National Bank has NPEs of 2.4% and coverage of 103% |
| Capital adequacy | 2nd | 3rd | 4th | 1st | CET1 15.5% / 14.5% / 12.9% / 17.5% |
| Loan and deposit growth | 2nd | 1st | 4th | 3rd | Loans / deposits: +10.5% / +10.6%, +13.1% / +13.3%, +8% / +9%, +13% / +7% |
| Q3 earnings momentum | 2nd | 1st | 4th | 3rd | n/a / +31% / −1% / +21% year on year (underlying; pre-exceptional for National Bank) |
| Revenue diversification | 3rd | 2nd | 1st | 4th | Fees 23% / 26% / 31% / 17% |
| Total rankings (equal weighting) | 15 | 19 | 20 | 16 | Lower total = stronger profile |
The ranking reflects our assessment of the banks' figures, and the use of equal weighting is arbitrary. Eurobank narrowly leads National Bank (15 points against 16), while Alpha (19) and Piraeus (20) follow, each with a different profile. National Bank combines capital strength and asset quality with the weakest nine-month profit growth; Alpha trades quality for growth, and Piraeus trades capital headroom for cost efficiency.
What we are watching
Eurobank. Completion and integration of Eurolife, its capital impact (about −120 bps) and the possible effect of the law on Swiss franc loans.
Alpha Bank. The review of provisioning models in Q4, the trajectory of NPEs, integration of acquisitions and delivery of the new 2026–2030 strategic plan, with 2030 targets of RoTE of about 16%, EPS of about €0.63 and an NPE ratio of about 2%.
Piraeus. Q4 delivery against its €0.90 EPS target, raising CET1 above 13%, and Treasury performance, which affected Q3.
National Bank. Accelerating loan growth in Q4 (the target of more than €3bn requires growth of more than €0.8bn, with about €2.5bn approved but not disbursed), the gap between expenses (+8%) and revenue (+3%), income from financial transactions (−35%) and use of its excess capital of about €2bn.
* Director of Research at Solidus Securities S.A., leading portfolio analysis and asset allocation optimisation, and developing integrated financial models to assess risk and forecast market trends. Chair of EEΡΑΜΑ - HACSA.
** This article is for information and educational purposes only and does not constitute investment, tax or legal advice. The figures are indicative, based on publicly available historical data, and do not guarantee future returns. Before making any investment decision, consult a certified investment adviser.