At a glance
| Share | Price 9 Nov (€) | Fair value (€) | Gap | Downside | Base case | Upside | Weighted (€) |
|---|
| Titan (ΤΙΤ) | 46.50 | 45.19 | −3% | 34.0 | 45.8 | 56.0 | 45.4 |
| Metlen (MTLN) | 45.92 | 47.60 | +4% | 33.2 | 49.9 | 65.4 | 49.6 |
The price is the closing price on Monday, 9 November 2026, on the Athens Stock Exchange. Fair value is our weighted estimate based on the information available to us today. The three scenarios are 12-month target prices, and the final column shows their weighted average.
Titan
Titan closed at €46.50 (+1.75%), recovering from Friday’s €45.70, its lowest level since April. With 74.4m shares in issue (78.3m in total less approximately 3.9m treasury shares), its market capitalisation is €3.46bn. Adding net debt of €958m and minority interests of about €350m (our estimate for Titan America’s 13.3% minority interest) gives an enterprise value of €4.77bn.
With 2026E EBITDA of €625m and EPS of €4.19, the share trades at 7.6x EV/EBITDA and 11.1x P/E.
Fair value
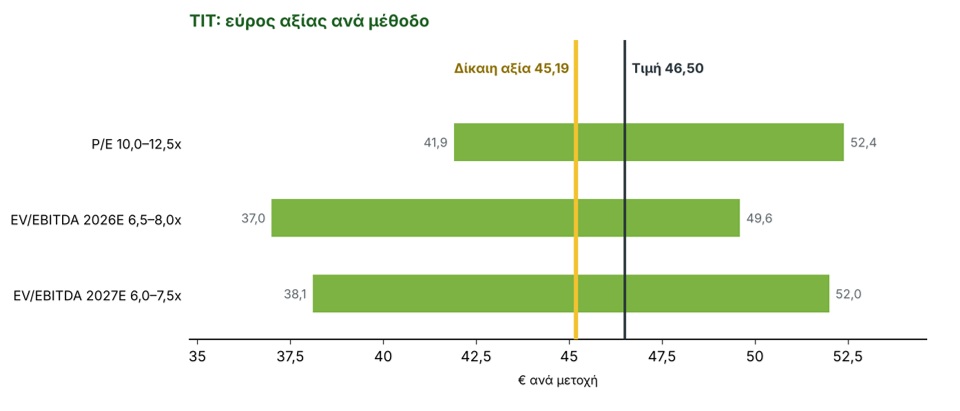
Fair value is €45.19, slightly below the share price (−2.8%). The current price is around the middle of the valuation range, while the market has already priced in pressure on third-quarter margins (EBITDA −9.0%, −17.6% LfL) and an implicit downgrade to guidance. Sensitivity remains high: every €10m of 2026E EBITDA translates into approximately €1.0 per share.
| Method | Low (€) | High (€) | Average (€) | Weight |
|---|
| P/E 10.0–12.5x | 41.9 | 52.4 | 47.1 | 40% |
| EV/EBITDA 2026E 6.5–8.0x | 37.0 | 49.6 | 43.3 | 40% |
| EV/EBITDA 2027E 6.0–7.5x | 38.1 | 52.0 | 45.0 | 20% |
| Fair value | | | 45.2 | 100% |
12-month target-price scenarios
The scenarios are based on 2027E EBITDA and net debt at the end of 2026. The downside scenario (25%) assumes that energy costs and weakness in the US keep 2026 EBITDA close to €610m and 2027 EBITDA at €640m (the first full year of contribution from the acquisitions), with a 6.0x multiple.
The base case (50%) uses the €690m EBITDA estimate from the previous analysis (+10%), with a 6.75x multiple. The upside scenario (25%) assumes that the January 2027 price increases in the US take effect and that Greece and the eastern Mediterranean continue to perform, with EBITDA of €740m and a 7.25x multiple.
| Scenario | 2027E EBITDA (€m) | EV/EBITDA | 2026E net debt (€m) | Target price (€) |
|---|
| Downside | 640 | 6.00x | 960 | 34.0 |
| Base case | 690 | 6.75x | 900 | 45.8 |
| Upside | 740 | 7.25x | 850 | 56.0 |
| Scenario | Probability | Target price (€) | Versus price |
|---|
| Downside | 25% | 34.0 | −27% |
| Base case | 50% | 45.8 | −2% |
| Upside | 25% | 56.0 | +20% |
| Weighted | 100% | 45.4 | −2% |
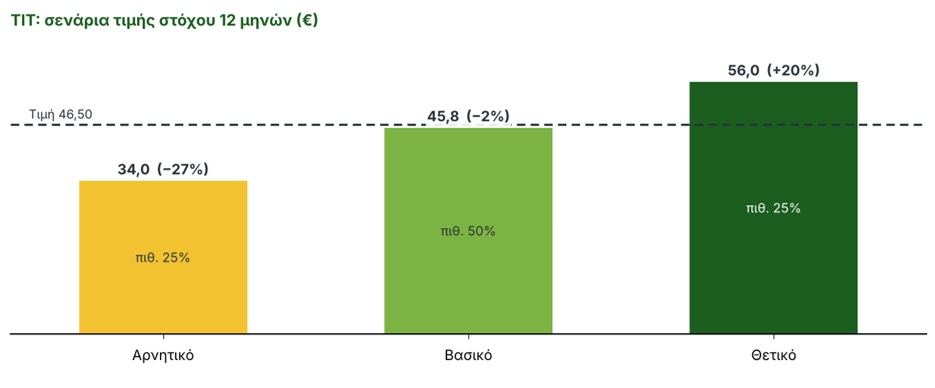
Minority interests of €350m are deducted in all scenarios.
What we are watching
- The fourth quarter, particularly in the US (nine-month EBITDA −11.4%): the group’s mid-single-digit EBITDA guidance requires an acceleration from the 1.7% growth recorded in the first nine months.
- Energy and raw material costs (more than €40m of additional costs in the first nine months, mainly in the third quarter) and the portion of that increase that will recur in 2027.
- US cement prices following the January 2027 increases, and demand in Florida.
- The acquisitions and the Prime programme: acquisitions contributed €28m of EBITDA in the first nine months (about €45m in 2026), while Prime delivered about €40m (about €60m in 2026) and its 2029 target was raised to €150m from €100m.
Metlen (MTLN)
Metlen closed at €45.92 (+1.59%). With 143.0m shares, its market capitalisation is €6.57bn and, including adjusted net debt of €1.37bn (our estimate based on half-year figures, excluding non-recourse debt), its enterprise value is €7.94bn: 7.4x the midpoint of 2026 EBITDA guidance (€1,075m).
We estimate 2026 EBITDA at €1,100m (€550m in the first half and a similar amount in the second, despite the 44-day H-Class shutdown) and a 57% conversion into net profit, implying EPS of €4.38 and a P/E of 10.5x.
The lack of data is the main problem. The nine-month trading update does not provide EBITDA, net debt or third-quarter figures, and we use the net debt figure from the half-year results. The outcome is sensitive: every €100m difference in debt translates into about €0.7 per share.
Fair value
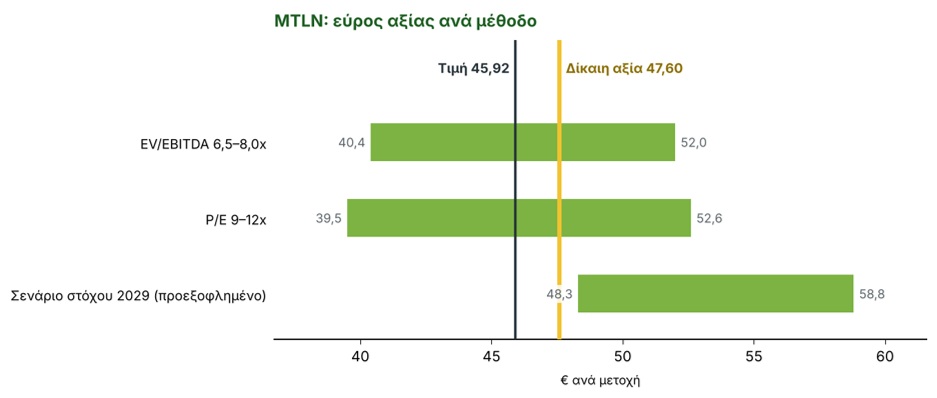
Fair value is €47.60, 3.7% above the share price. The two main methods (each weighted at 40%) give a value of about €46, while the third (20%) is based on the medium-term 2029 target scenario (EBITDA of €2.0bn, 5.5–6.5x, debt of €1.8bn, discounted at 10% over three years), which we do not regard as our base estimate: 2025 EBITDA fell 30% and the 2029 target is almost double the midpoint of 2026 guidance.
| Method | Low (€) | High (€) | Average (€) | Weight |
|---|
| EV/EBITDA 6.5–8.0x | 40.4 | 52.0 | 46.2 | 40% |
| P/E 9–12x | 39.5 | 52.6 | 46.0 | 40% |
| 2029 target scenario (discounted) | 48.3 | 58.8 | 53.5 | 20% |
| Fair value | | | 47.6 | 100% |
12-month target-price scenarios
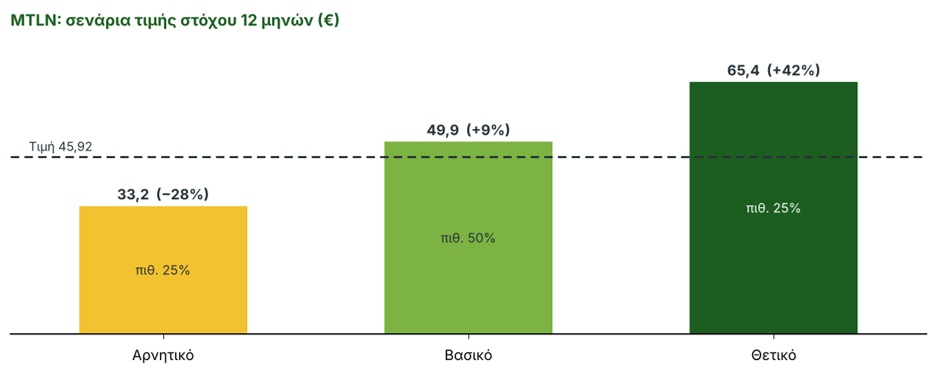
The downside scenario (25%) assumes EBITDA at the lower end of guidance and only a modest increase in 2027 (€1,050m), higher debt (€1,550m) and a 6.0x multiple. The base case (50%) assumes €1,250m (+14%, well below the growth rate required to meet the 2029 target) and a 6.75x multiple. The upside scenario (25%) assumes €1,400m (Citi’s 2027 estimate is €1,335m) and a 7.5x multiple.
The upside is substantial, but is balanced by a 28% fall in the downside scenario.
| Scenario | 2027E EBITDA (€m) | EV/EBITDA | 2026E adjusted net debt (€m) | Target price (€) |
|---|
| Downside | 1,050 | 6.00x | 1,550 | 33.2 |
| Base case | 1,250 | 6.75x | 1,300 | 49.9 |
| Upside | 1,400 | 7.50x | 1,150 | 65.4 |
| Scenario | Probability | Target price (€) | Versus price |
|---|
| Downside | 25% | 33.2 | −28% |
| Base case | 50% | 49.9 | +9% |
| Upside | 25% | 65.4 | +42% |
| Weighted | 100% | 49.6 | +8% |
What we are watching
- Full-year results: EBITDA, net debt and the definition of non-recourse debt.
- Market conditions. In Greece’s power system, hydropower output doubled (5.0 TWh from 2.5 TWh) and renewables increased (23.4 TWh from 19.8 TWh), while natural gas-fired generation fell 3%. Over the same period, METLEN’s thermal generation declined 8% (5.9 TWh from 6.4 TWh), while its renewable generation was 0.6 TWh.
- Execution of the M Energy Transition Platform (formerly M RESET) and critical metals projects (first shipments by the end of 2026).
- The possible listing of METKA on Euronext Athens and completion of the sale of Tamarico II.
Assumptions and limitations
The valuation calculations, scenario probabilities and 2027E assumptions are our own. The probabilities are judgements, not measurements, and the weighted price changes by about €0.3–1.6 per share for a five-percentage-point shift between the downside and upside scenarios.
* Director of Research at Solidus Securities S.A., leading portfolio analysis and asset allocation optimisation, and developing integrated financial models to assess risk and forecast market trends. President of EEPAΜΑ - HACSA.
** This article is for informational and educational purposes and does not constitute investment, tax or legal advice. The figures are indicative, based on publicly available historical data, and do not guarantee future returns. Before making any investment decision, consult a certified investment adviser.