Trading is the buying and selling of financial instruments to profit from price movements over a relatively short time horizon, from seconds to a few months. Instruments traded can include shares, bonds, foreign exchange, commodities, indices or derivatives.
The difference from investing lies in the source of returns. An investor buys a stake in a company’s future profits and waits at least several months, and usually more than a year. A trader buys a price move and decides in advance when to exit, whether at a profit or a loss.
| Criterion | Trading | Investing |
|---|
| Time horizon | Minutes to months | Years |
| Source of returns | Price movements | Profits, dividends, growth |
| Main tool | Technical analysis, order flow | Fundamental analysis, valuation |
| Exit | Predefined (stop and target) | When the investment case changes |
| Transaction costs | Crucial | Secondary |
Trading is not about prediction but managing probabilities. No one knows what the next move will be. What we can control is how much we risk, when we enter and when we exit.
The main styles
Trading styles differ mainly in how long a position is held, and that determines how much time is needed in front of a screen. The choice depends on each person’s available time, capital and temperament, not on which style “makes more money”.
| Style | Holding period | Chart timeframe | What it requires |
|---|
| Scalping | Seconds to minutes | 1 to 5 minutes | Very low commissions, fast execution, full-time commitment |
| Day trading | Within the trading session | 5 to 60 minutes | No overnight positions, discipline in sticking to a daily loss limit |
| Swing trading | Days to weeks | 4-hour and daily | Tolerance for gaps at the open, a little time each day |
| Position trading | Weeks to months | Daily and weekly | Patience, wider stops, smaller positions |
For people who also have a job, swing trading is usually the realistic starting point: decisions can be made after the close, and transaction costs have less impact.
Techniques
Most strategies fall into four categories. Each works in a particular market environment and performs poorly in the opposite one, so the first step is to identify whether the market is trending or range-bound.
Trend following (trend following)
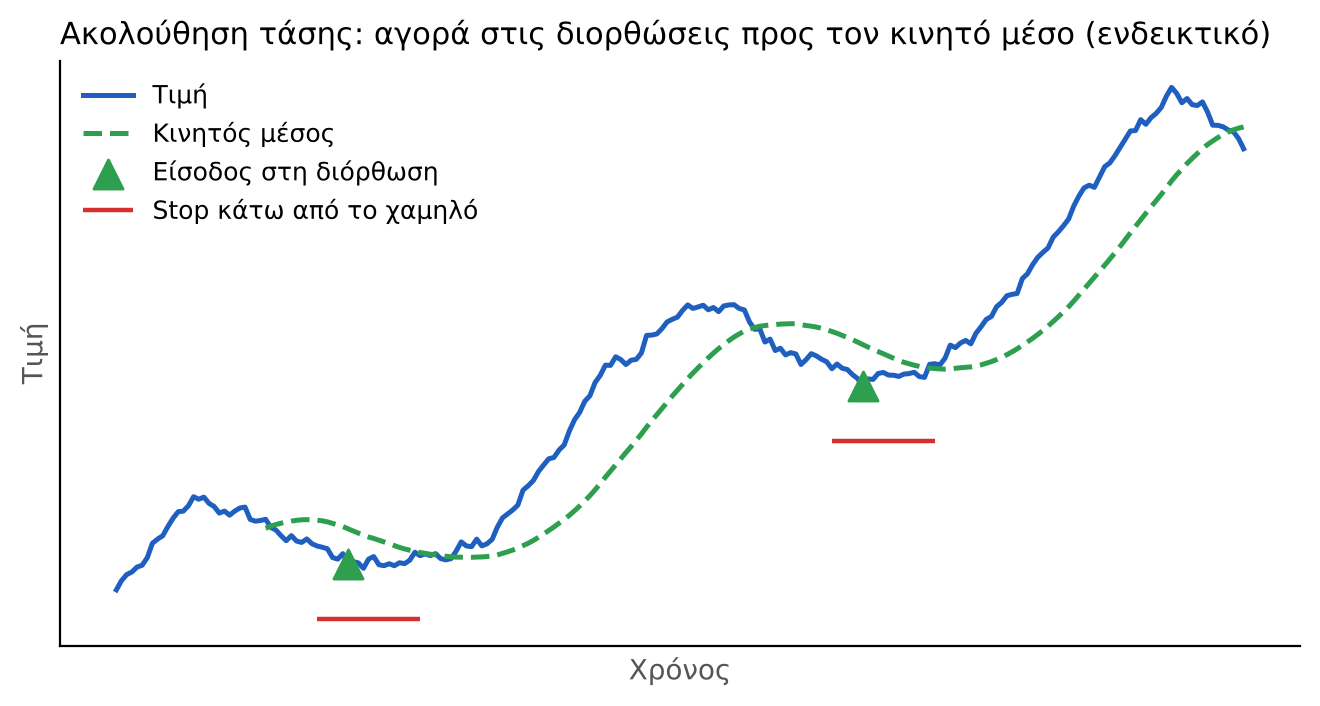
We buy what is already rising and sell what is already falling. A trend is defined by higher highs and higher lows, or by the price being above a rising moving average (usually the 50-day or 200-day). Entry is on a pullback towards the moving average or a previous resistance level that has turned into support, while a few large winning trades pay for many small losses.
Breakout (breakout)
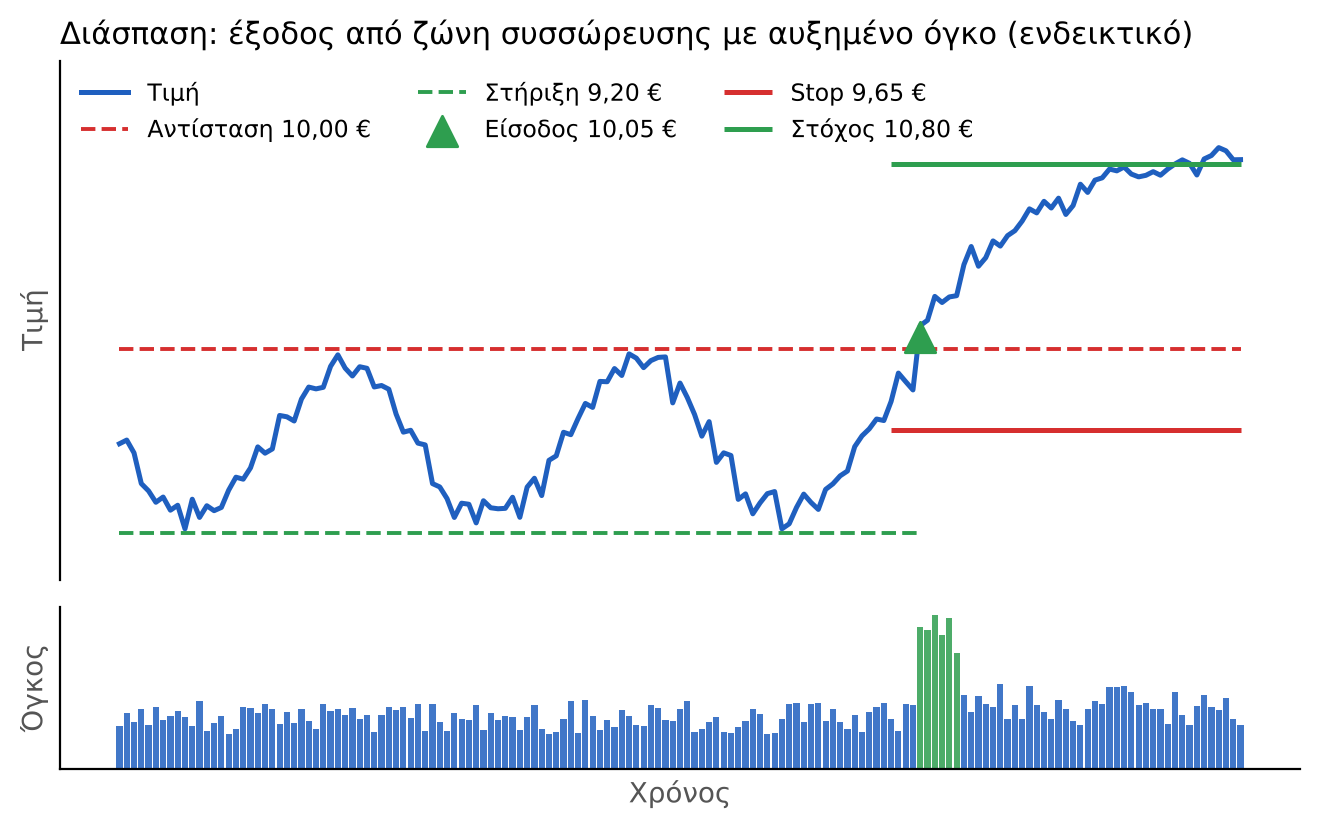
We enter when the price breaks out of a consolidation zone (rectangle, triangle, flag) on higher volume. Volume provides confirmation, as breakouts on thin volume often fail; the stop is placed inside the zone so that a false breakout costs little.
Mean reversion (mean reversion)
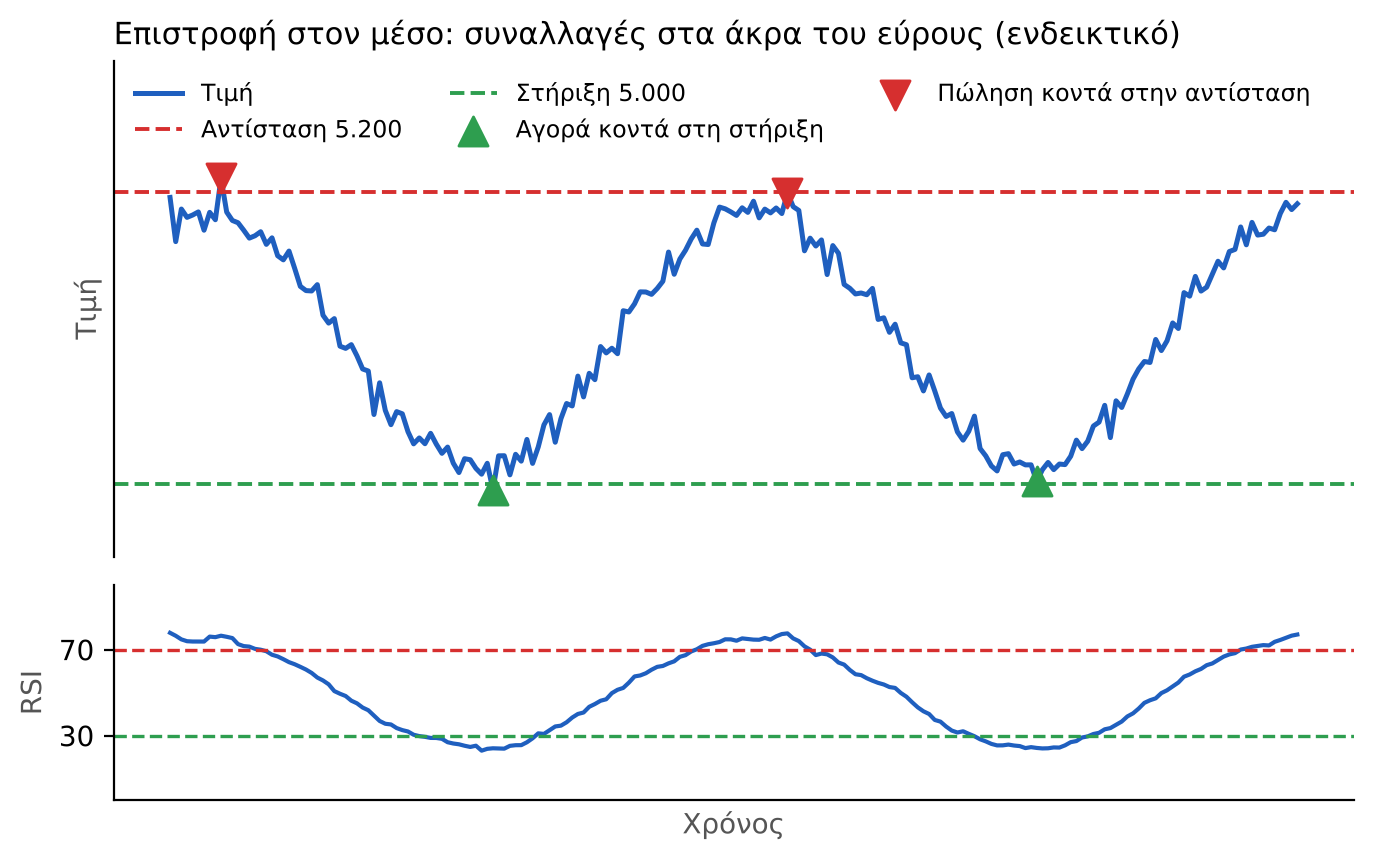
In a market without a trend, we buy near support and sell near resistance. Tools include the RSI (below 30 is oversold, above 70 is overbought) and Bollinger Bands. The risk is buying something that looks “cheap” but has just started a downtrend, or vice versa.
Trading on news and events
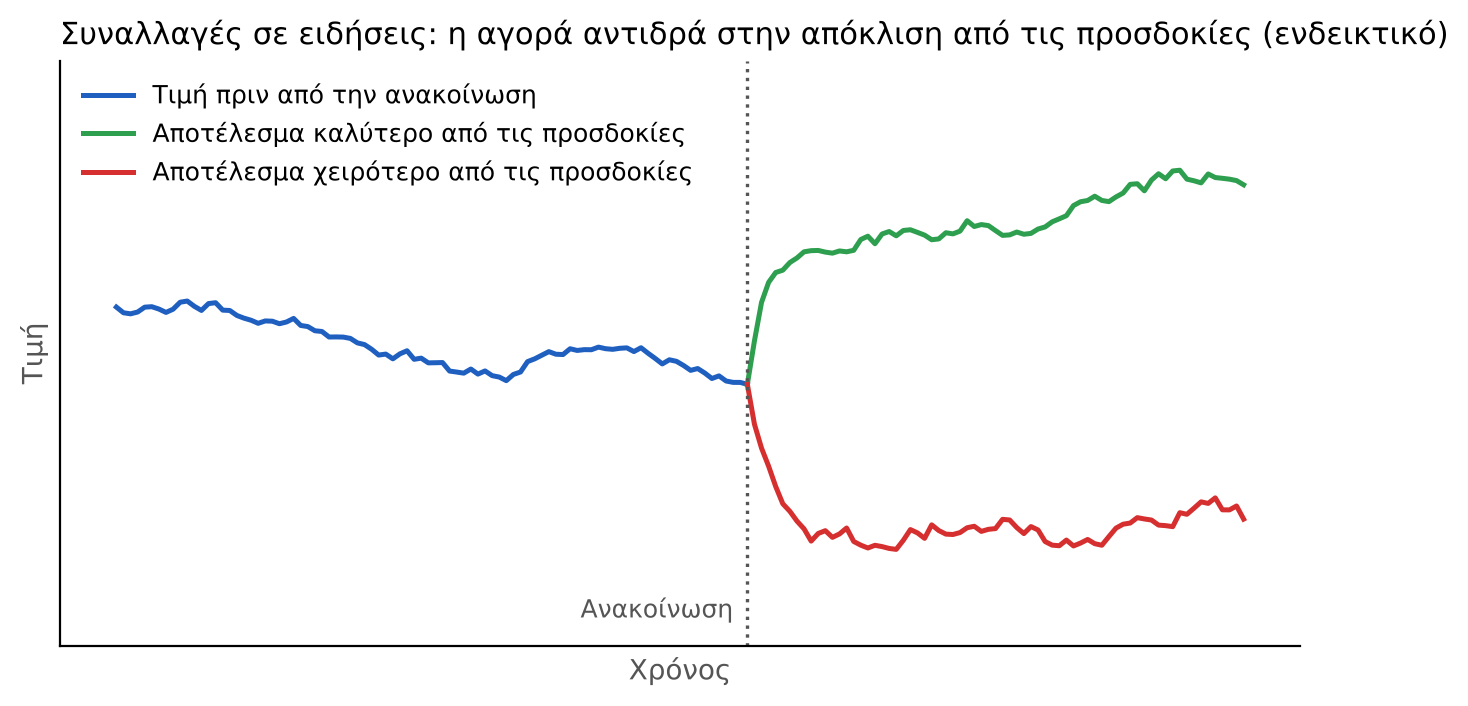
Company results, central bank decisions and macroeconomic data can trigger sharp moves. What matters is not the number itself but how it differs from expectations. Spreads widen and slippage increases, so we reduce position size.
Technical indicators
| Indicator | What it measures | How we use it |
|---|
| Moving averages (20, 50, 200) | Trend direction | Filter: buy only above the 200-day moving average |
| RSI (14) | Momentum, extremes | Divergences with price, levels 30 and 70 |
| MACD | Change in momentum | Signal-line crossovers, histogram |
| Bollinger Bands | Volatility around the average | Narrow bands warn of a sharp move |
| ATR (14) | Average daily range | Stop distance and position size |
| Volume, VWAP | Participation, average price for the day | Breakout confirmation, intraday benchmark |
Two or three indicators from different categories (trend, momentum, volatility) are enough. Five oscillators together show the same thing five times.
Tools
The tool with the greatest impact on results is the trading journal, not the platform. The others support execution and analysis.
| Tool | Use | What to look out for |
|---|
| Broker and execution platform | Order routing | Regulation, commissions, execution quality, borrowing costs |
| Charting software | Technical analysis, price alerts | Multiple timeframes on the same screen |
| Screener | Finding potential securities | Liquidity criteria, not just the technical picture |
| Economic calendar | Macroeconomic and company results announcements | Never have an open position during an announcement without knowing it |
| Trading journal | Recording entry, exit, rationale and result | Weekly review by strategy |
| Historical data testing (backtesting) | Testing rules before risking real money | Commissions, slippage, overfitting to the data |
Common order types
- Market order: executed immediately at the best available price. Execution is certain; the price is not.
- Limit order: executed only at our price or better. The price is certain; execution is not.
- Stop-loss order: closes the position when the price reaches the level at which the trade scenario is invalidated. If the market opens with a gap, it will be executed at a worse price than that level.
- Trailing stop: follows the price at a fixed distance and locks in profits on trend trades.
- Linked orders (OCO, bracket): target and stop are placed together; execution of one cancels the other.
Leverage, CFDs and derivatives are also tools, but they magnify losses as much as gains: leverage of 10 to 1 means a 10% move against us wipes out the capital.
Trading and risk management
Risk management determines whether a trader survives long enough for their strategy’s edge to emerge. Entry is the least important part of a trade.
The 1% rule
We risk up to 1% of our capital on each trade, and no more than 2%, so that ten consecutive losses cost about 10%, rather than wiping out all our capital. The asymmetry of losses explains why: a 50% loss requires a 100% gain to get back to the starting capital.
Position size
Position size is determined by the stop, not the other way round:
Shares = (Capital × Risk percentage) / (Entry price − Stop price).
With capital of €20,000, 1% risk (€200), an entry at €10.00 and a stop at €9.60, we buy 200 / 0.40 = 500 shares, a position worth €5,000.
Risk-to-reward ratio
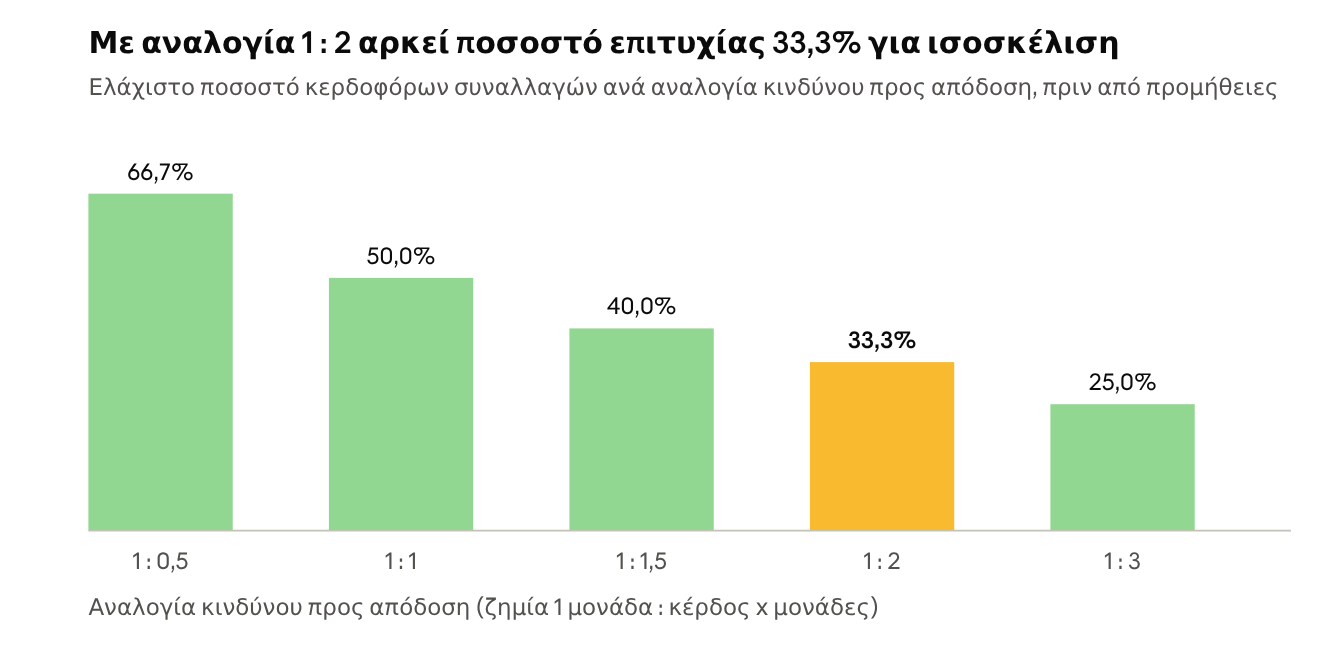
Calculation: break-even rate = 1 / (1 + reward-to-risk ratio), excluding transaction costs
The greater the expected gain relative to the loss, the less often we need to be right, which is why we avoid trades with a ratio below 1 : 1.5.
Mathematical expectation: E = p × W − (1 − p) × L
where p is the win rate, W the average gain and L the average loss. With a 40% win rate, an average gain of 2R and an average loss of 1R, the expected value is 0.4 × 2 − 0.6 × 1 = +0.2R per trade (where R is the amount we risk),
A strategy that loses most of the time can be profitable, and vice versa.
Examples
The three examples are hypothetical and illustrate the logic of the plan, not actual trades. In all cases, we assume capital of €20,000 and risk of 1% (€200) per trade.
| Example | Entry | Stop | Target | Risk per unit | Ratio | Position size |
|---|
| 1. Stock breakout | €10.05 | €9.65 | €10.80 | €0.40 | 1 : 1.9 | 500 shares |
| 2. Mean reversion in an index | 5,015 | 4,975 | 5,100 | 40 points | 1 : 2.1 | €5 per point |
| 3. Pullback in an uptrend | €24.30 | €23.4 | Trailing stop | €0.90 | Open-ended | 222 shares |
1. Stock breakout (swing)
A stock trades between €9.20 and €10.00 for six weeks and closes at €10.05 on volume double the 20-day average. We buy at the close, with a stop at €9.65 inside the zone and a target of €10.80 (the €0.80 height of the zone projected above the breakout), making €375 at the target or losing €200 at the stop.
2. Mean reversion in an index
An index trades between 5,000 and 5,200 points without a trend, falls to 5,010 with the RSI at 28 and forms a bullish reversal candle. We buy at 5,015, with a stop at 4,975 and a target at the midpoint of the range, 5,100. If the index closes below 5,000, the range has been broken and the strategy no longer applies.
3. Pullback in an uptrend
A stock in an uptrend pulls back towards its 50-day moving average at €24.00, and we buy at €24.30 after a bullish candle, with a stop at €23.40 (1.5 times the ATR of €0.60). We do not set a fixed target, but move the stop below the 20-day moving average as long as the trend continues, making a profit of €3.60 per share, or 4R — about €800 — if we exit at €27.90.
Psychology and mistakes
Most retail traders lose money because of their behaviour, not a lack of technical knowledge. ESMA found that 74% to 89% of retail CFD accounts lose money.
- Loss aversion: we close winning positions quickly and hold on to losing ones, hoping they will recover.
- Moving the stop: the stop is moved further away again and again as the price approaches, turning a small loss into a large one.
- Averaging down on a losing position: we add to a position in something that is already disproving our scenario.
- Revenge trading: after a loss, we increase the position size to “win back” what we have lost.
- Overtrading: boredom leads to trades without a technical edge, and commissions rise along with losses.
- Overconfidence: after a run of wins, rules are relaxed and positions — and “bets” — grow larger.
The defence is a written plan before every trade: why we are entering, where we will exit at a loss, where we will exit at a profit, and how much we are risking. A daily loss limit, for example 3R, ends the session before a bad day turns into a bad month.
Profitable trading rests on three things: a strategy with positive mathematical expectation, position sizing that can withstand inevitable runs of losses, and discipline in following the plan.
* Director of Research at Solidus Securities S.A., overseeing portfolio analysis and asset allocation optimisation and developing comprehensive financial models to assess risk and forecast market trends. Chair of EE PAMA - HACSA.
** This article is for information and educational purposes and does not constitute investment, tax or legal advice. The figures are indicative, based on publicly available historical data, and do not guarantee future returns. Before making any investment decision, consult a certified investment adviser.