Two of the Athens Stock Exchange’s leading industrial stocks, Titan and Metlen Energy & Metals, continue to be the focus of investors due to their exposure to infrastructure development, the energy transition, and global demand for materials and metals.
Titan is trading around €50 with a market capitalization of approximately €4 billion, while Metlen is trading around €40.70 with a market capitalization of nearly €5.8 billion. Both have shown resilience, despite geopolitical tensions and fluctuations in energy and raw material prices.
Analysts remain generally optimistic, focusing on growth through acquisitions, production expansion, and the environmental transition. For Titan, first-quarter results this year were at historic highs, with sales up 4.7% and EBITDA up 16% year-over-year.
Management expects stable volumes for 2026 with improved margins (price-cost) and a significant contribution from recent acquisitions (such as Keystone Cement). Analysts give an average target price of around €63 (27% upside), with a “buy” recommendation. The TITAN Forward 2029 strategy aims for significant EBITDA growth, lower emissions, and investments of around €300–350 million annually.
For Metlen, despite challenges in specific projects, the outlook for 2026 remains strong with estimated EBITDA of €1.1–1.3 billion. The company is benefiting from the recovery in the metals/energy sector, major renewable energy and battery energy storage (BESS) projects, and its partnership with PPC. Analysts set an average target price of €55 (with an upside of nearly 35%), with a high estimate of €61 and a “buy” recommendation. These two stocks may offer the highest upside potential among large-cap stocks.
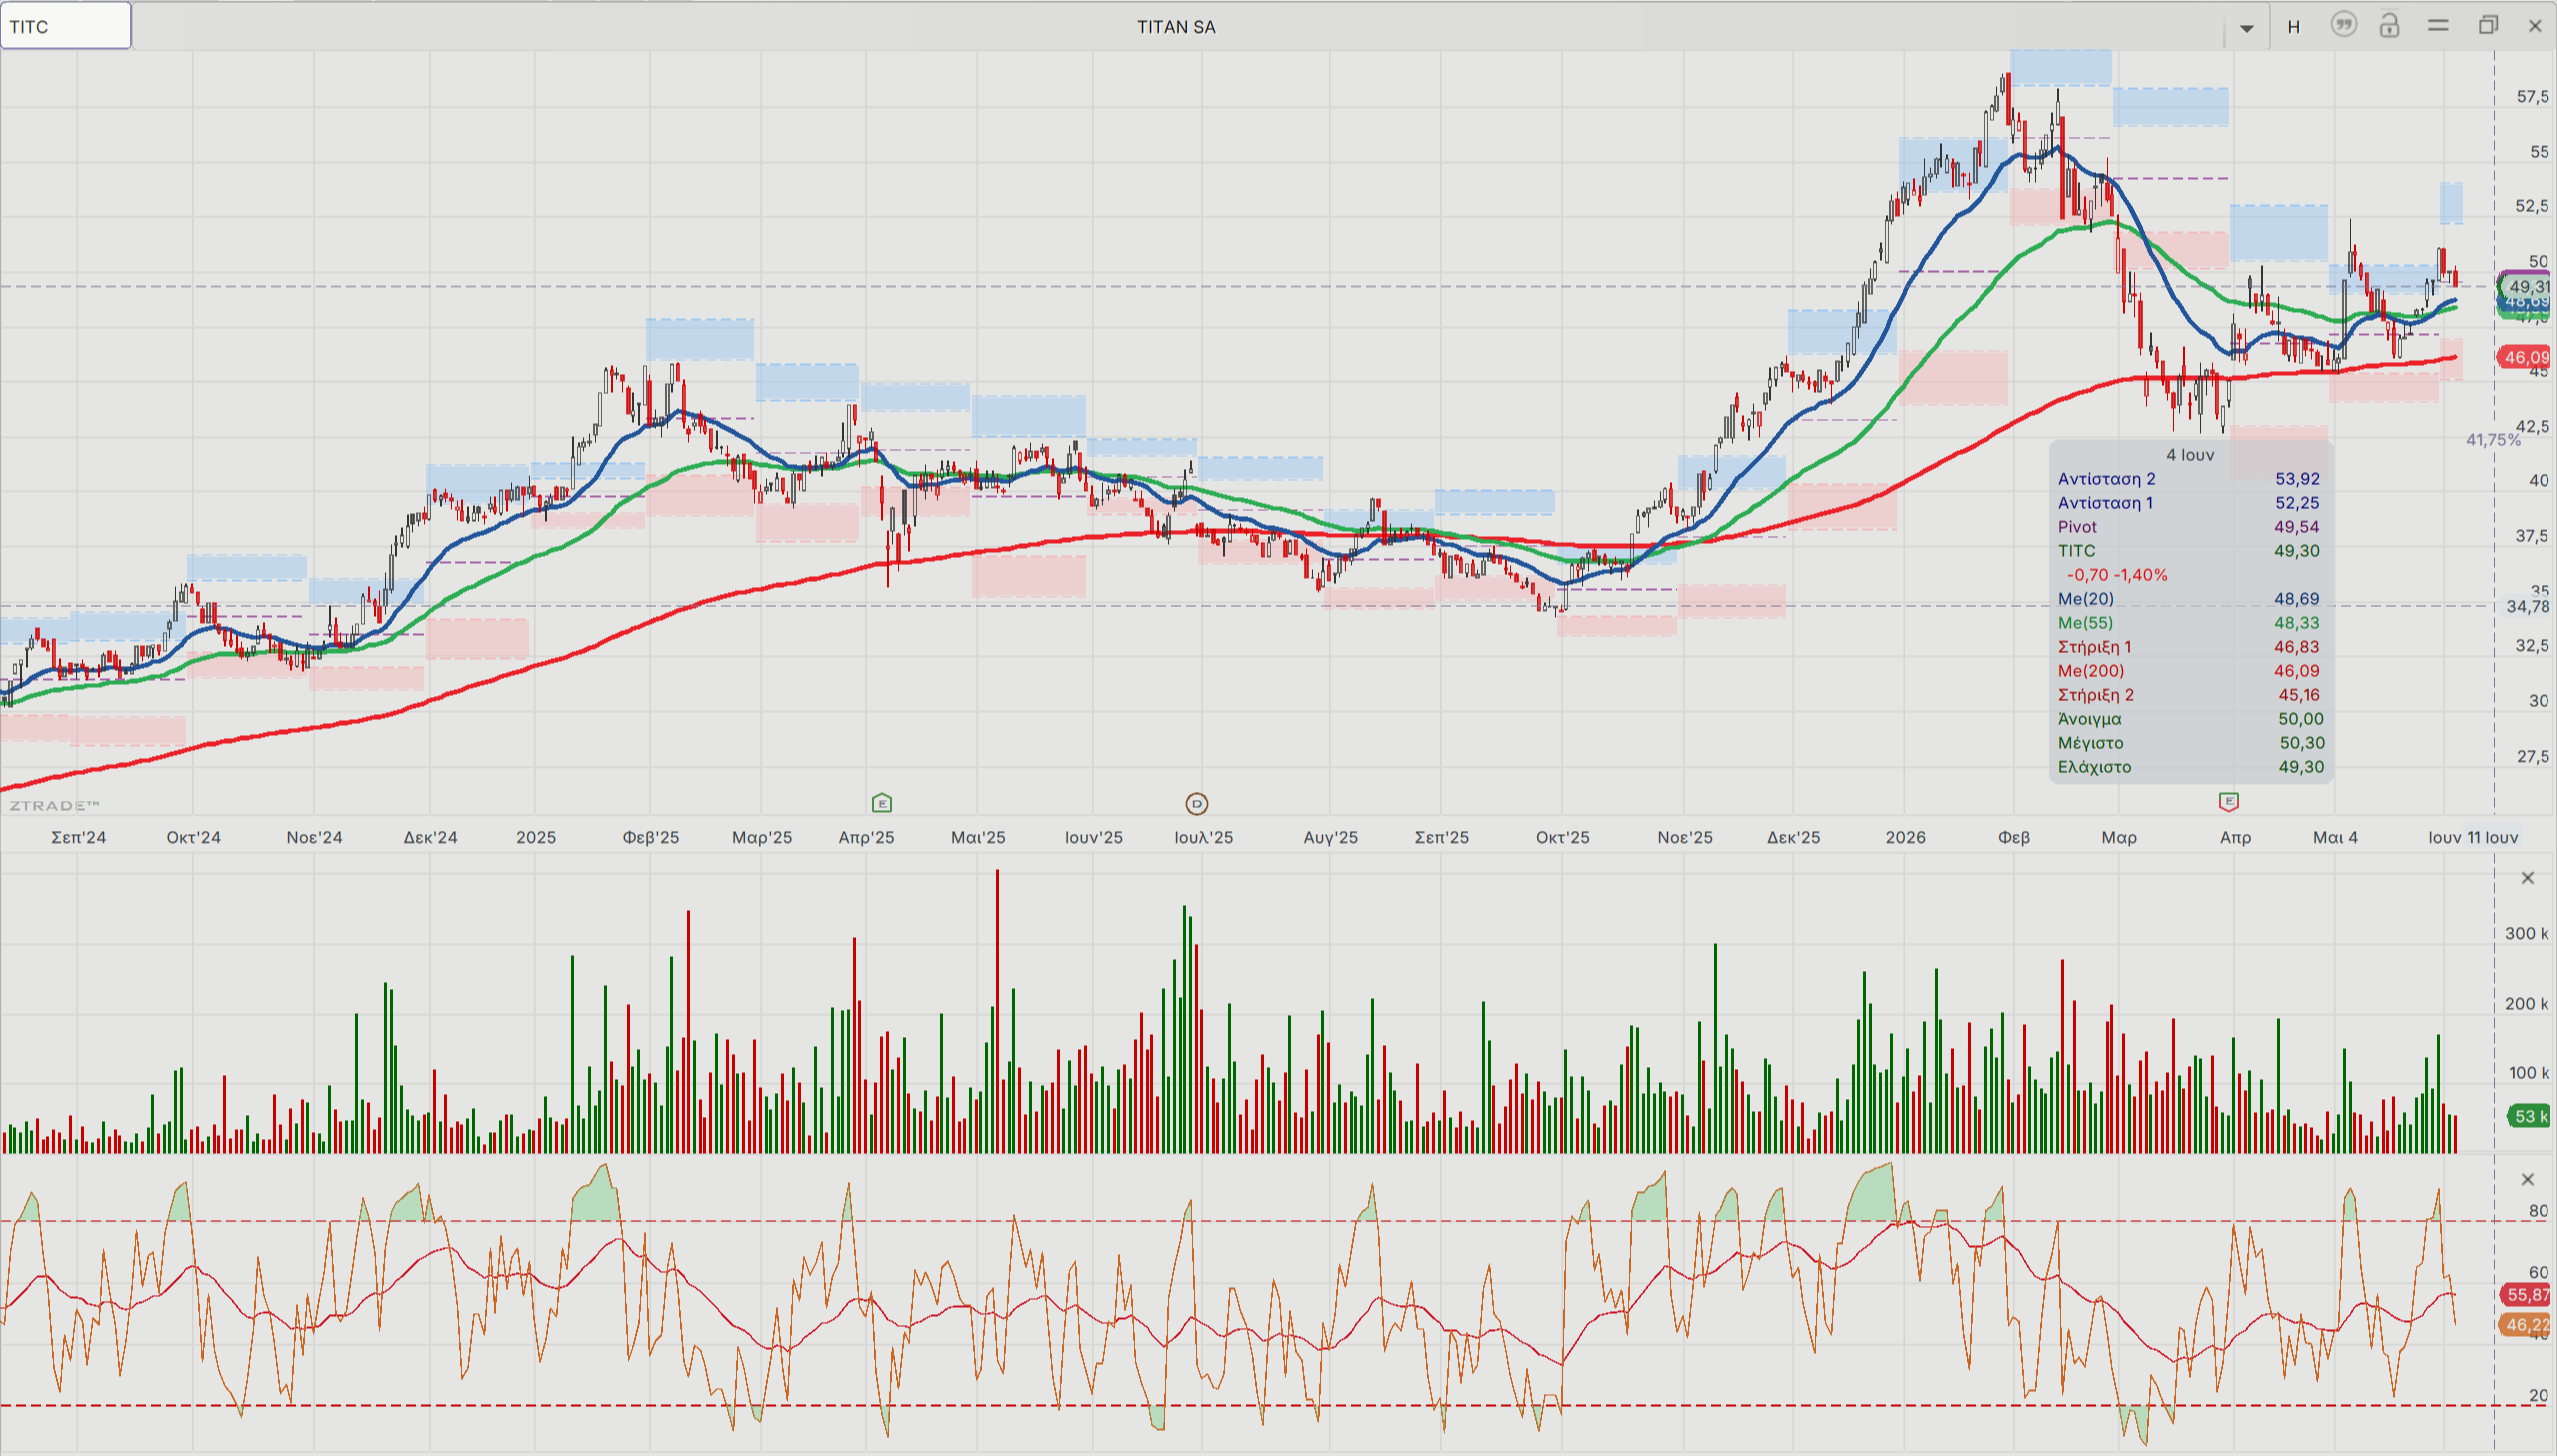
The technical picture for Titan and Metlen
On the daily chart, Titan shows strong momentum according to most technical indicators. The stock is trading at high levels following a recent correction, with support at €48.50–49.00 and resistance at €50.50–51.50.
The 14-day RSI oscillator is near the 55-60 levels (neutral to bullish), and the MACD indicator is positive with upward momentum. On a weekly basis, the outlook remains positive. A break above €51.50–52.00 will trigger targets toward €55 or higher, while a break below €48 will exert downward pressure in the short term.
The Titan chart
For Metlen on the daily chart, improving technical signals are being recorded. The price is stabilizing around €40.70–41.00 following a pullback from the highs. The main support is at 39.80–40.20 euros and resistance at 41.50–42.00 euros.
The RSI(14) is at 52-55 (neutral zone), while the MACD is slightly positive. On a broader horizon (52-week range of €30.50-57.73), the stock has significant upside potential.
Staying above €40 maintains the bullish scenario with targets of €44–46 in the short term and €52–55 in the long term. A break below €39.50 would be a warning sign.
Metlen’s chart
.png)
Overall, both stocks present a stable to positive technical picture, with Titan showing stronger momentum in the short term. Fundamentals (acquisitions, backlog, expansion of operating margins) support further upside for their shares, particularly in an environment of infrastructure growth and the green transition.
* The above article does not constitute an investment strategy recommendation regarding financial instruments or issuers of financial instruments and does not contain any opinion regarding the current or future value of financial instruments. The information and opinions in this article are provided for the reader’s information only.