From the tulip mania in the Netherlands of 1637 to the cryptocurrency fever of 2021, financial history repeats, with striking consistency, the same basic pattern: a prolonged divergence of an asset’s prices from its fundamental value, fueled by excessive expectations and speculation.
Understanding how market bubbles form, evolve, and collapse is a key tool for any investor who wishes to protect their capital from cycles of euphoria and panic.
The question is no longer academic. In June 2026, the Bank for International Settlements (BIS) explicitly warns that the investment boom in artificial intelligence “resembles” the railways of 1840 and the dot-com of 2000, while the Shiller CAPE index stands at the second-highest level in 150 years of records.
This article examines the Minsky model, the historical examples, the behavioral psychology behind every bubble — and, finally, using the most recent data, whether the 2026 market is already inside a new bubble.
The Minsky Model
Economist Hyman Minsky described in 1992 a five-phase framework that explains with great accuracy the life cycle of every bubble.
- Displacement: an external shock — a new technology, a regulatory change, or a geopolitical development — that creates new expectations of profitability.
- Boom: a gradual upward phase in which participation broadens.
- Euphoria: speculation dominates and valuations become fully disconnected from fundamentals.
- Profit Taking: the more experienced participants begin to liquidate discreetly.
- Panic: mass selling and a sharp collapse in prices.
The model is particularly valuable precisely because it does not predict when the reversal will occur — only that each phase sows the ground for the next.
Historical bubbles
The comparison of ten of the best-known bubbles in history — from the tulips of 1637 to the cryptocurrencies of 2021 — reveals striking similarities in the magnitude of both the rise and the subsequent collapse. The average magnitude of the rise in major historical bubbles approaches +650%, with an average subsequent collapse of about -75%.
The average duration of a bubble, from launch to burst, is about three years, while the full recovery of prices requires on average 7 to 10 years — only about 45% of cases fully recover their previous peak.
The biggest financial bubbles in history
Historical data, approximate decline from the peak (%)
| Case | Period | Decline (%) |
|---|
| Tulips | 1637 | >-90,0% |
| South Sea Company | 1720 | -85,0% |
| Mississippi Company | 1720 | -95,0% |
| Reichsmark (Germany) | 1923 | -100,0% |
| Stock Market Crash '29 (Dow Jones) | 1929 | -89,0% |
| Nikkei (Japan) | 1989 | -80,0% |
| Dot-com (Nasdaq) | 2000 | -78,0% |
| Housing / Lehman (S&P 500) | 2008 | -57,0% |
| Crypto (Bitcoin) | 2017-2018 | -84,0% |
| Crypto (Bitcoin) | 2021-2022 | -77,0% |
|
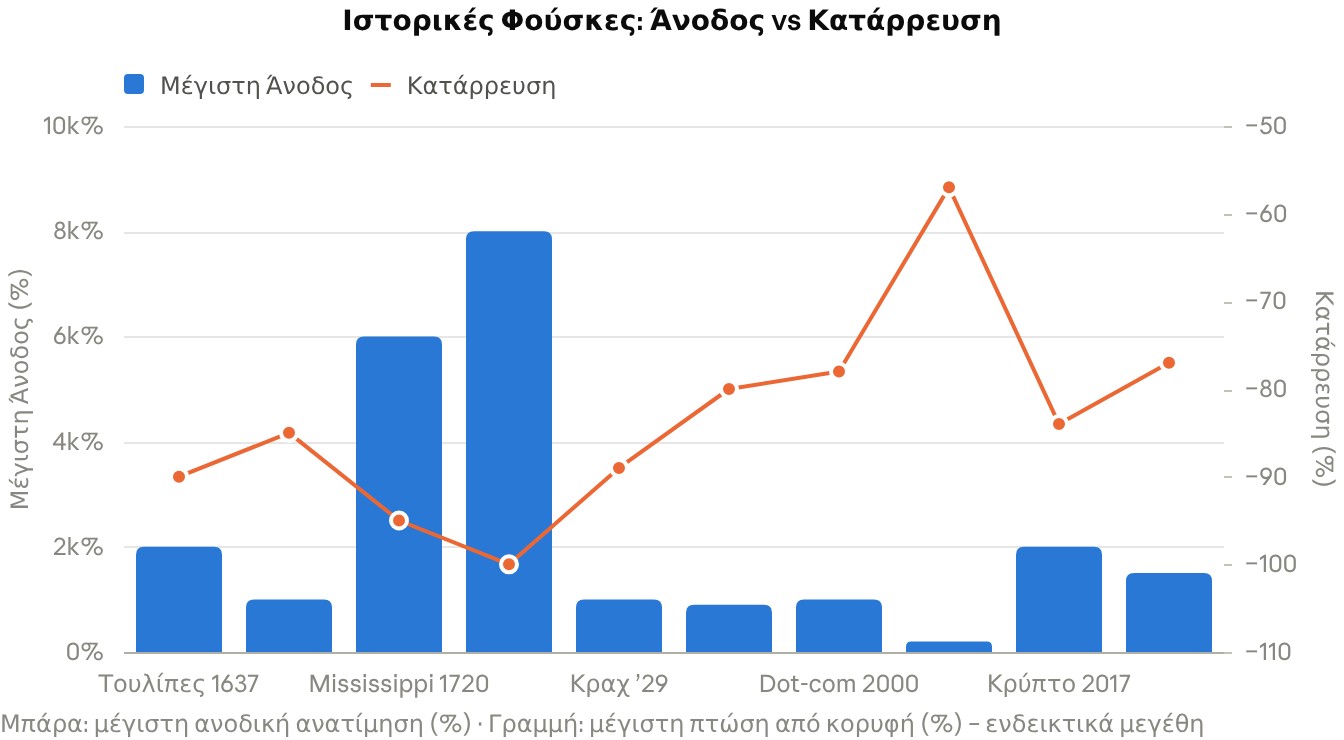
Comparison of maximum upward appreciation and collapse in 10 historical bubbles
Beyond differences in era and market, the numbers are strikingly consistent: when a bubble bursts, the asset usually loses most of its value, not 20-30%.
Warning signals
Despite their differences in era and market, most bubbles share a common “DNA.” Technological or institutional innovation appears in about 8 out of 10 cases, while regulatory laxity is recorded in 9 out of 10. Rapid credit expansion, with leverage increasing on average by more than 200%, and the mass entry of speculative, inexperienced investors — often 3 to 5 times above normal participation levels — are almost always part of the picture.
Ten signals are worth monitoring for every investor:
- P/E valuation ratios above 30-35 times, or Shiller CAPE above 30 (versus a historical average of about 16).
- Rapid credit expansion with new all-time highs in margin debt.
- “New era” rhetoric claiming that traditional indicators no longer apply.
- A sudden influx of large numbers of retail investors.
- A frenzy of IPO listings for companies without profits.
- Warnings from supervisory bodies such as the IMF or the BIS.
- An excessively overvalued real estate market.
- Inversion of the yield curve simultaneously with an overbought stock market.
- The classic sense of FOMO — the fear that “if you don’t buy now, you’ll miss the big opportunity.”
- “This time is different” narratives, supposedly meaning the old rules no longer apply.
Behavioral Finance
The science of behavioral finance explains why, despite the lessons of history, investors continue to fall into the same trap.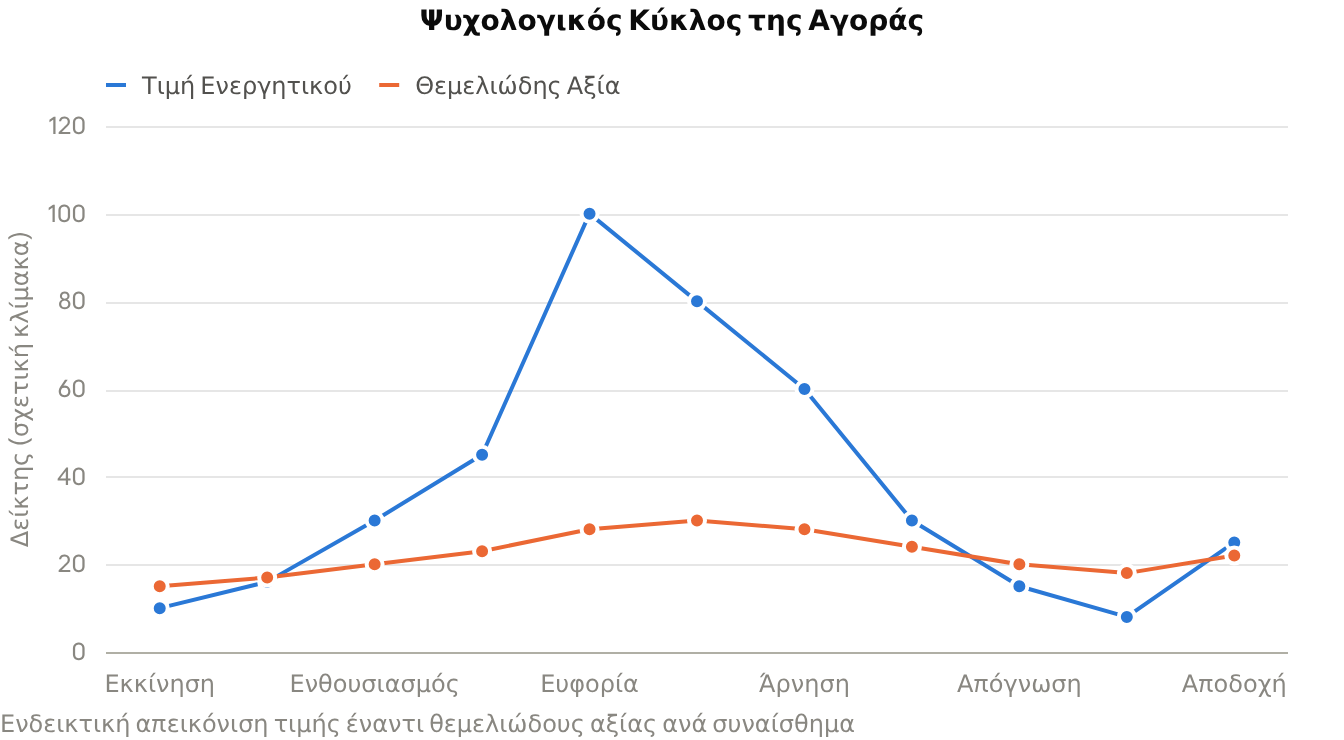
Herding bias: the logic of “if everyone is buying, I should buy too” suppresses critical thinking — characteristically, about 80% of the companies that went public in 1999-2000 were loss-making.
Overconfidence: leads investors to believe they understand the market better than what is actually happening, as shown by the belief that “Japan cannot fall” before the collapse of the Nikkei in 1989.
Anchoring: keeps investors attached to earlier price levels even when fundamentals have changed radically.
Confirmation bias: drives them to seek only information that confirms their already formed beliefs.
FOMO: leads to buying exactly at the top, while the narrative “this time is different” convinces people that the cycle will not repeat.
Hindsight bias: “I knew it would fall” offers no practical value before the crisis and often prevents meaningful learning.
The AI “bubble”
It does not take hindsight to see that the current framework matches today’s environment to a significant degree: the S&P 500’s Shiller CAPE reached 40.6 in September 2026 — the second-highest level in 150 years of records, just 3.6 points below the all-time record of 2000 (44.2) and far above 1929 (~30) or 2007 (~27). Historically, every time the index decisively exceeded 30, it has been a harbinger of a correction — not immediate — of at least 20% or more.
In the same period, margin debt — borrowed money secured by shares that investors use for leverage — reached a new all-time record of $1.45 trillion in August 2026, up 37.2% year-on-year. Analysts show that at all previous major peaks — 2000, 2007, 2021 — margin debt had peaked a few months before the stock market.
The Bank for International Settlements (BIS) put the issue at the center of its annual report (29/6/2026), noting that the five largest providers of computing power are expected to spend more than $1 trillion in capital expenditures related to AI in 2025-2026, and compares the phenomenon to previous “technological” bubbles, such as the railways of the 1840s and the dot-com of 2000.
Particular concern is caused by the so-called “circular financing”: major computing power providers invest in AI companies, which in turn commit to multi-year contracts to purchase computing power from those same providers — a web of mutual reinforcement that, if broken, risks spreading across the entire supply chain and causing, in the BIS’s wording, an “extensive credit” (credit crunch) in the event of a reversal.
Individual analysts point out that some AI sector stocks are trading at price-to-sales ratios above 30 — historically associated with bubbles — while the Federal Reserve has cited investments in AI data centers as one of the sources of inflationary pressure.
The same parallel with the dot-com era is interesting: then too, the underlying technologies (internet) were truly transformative, but it took years for the businesses using them economically to “mature” — the value of the internet was real, but the valuations of 2000 were not.
This does not mean that AI is a “bubble” in the sense that it will not change the world — it means that, as with the internet, current valuations may temporarily disconnect from the fundamental value it will ultimately create.
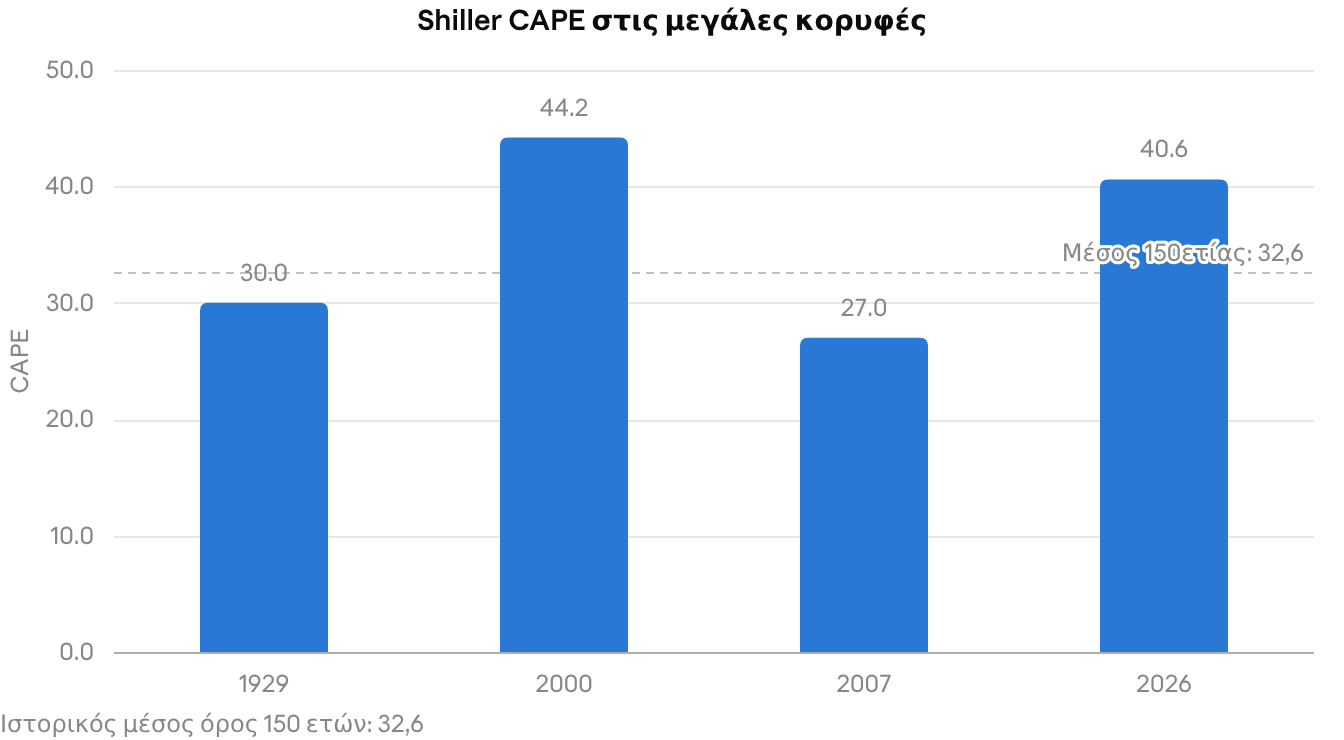
SOURCES: Gurufocus, Chamberlin Financial (September 2026)
From bubble to crisis
The bursting of a bubble usually follows a recognizable chain of events. A catalyst — the bankruptcy of a company, a regulatory intervention, or an unexpected event, such as the fall of Lehman Brothers in 2008 or the collapse of Terra/Luna in 2022 — triggers a reversal of liquidity: margin calls force selling, which fuels further selling in a self-reinforcing loop.
This is followed by contagion to other markets through interconnected balance sheets, ETFs and derivatives, while banks restrict their lending, hurting the real economy. In the final stage, central banks and governments intervene through quantitative easing, interest rate cuts, or fiscal support measures — intervention that, historically, almost always comes with a delay.
The same logic also applies to the AI “circular financing” mentioned above: the more interconnected the balance sheet items supporting a rise are, the faster and more extensive the reversal can be when the time comes.
Investment lessons
- Always assess the fundamental value of an asset — price and value are not the same.
- Be cautious when the majority of the market is excessively optimistic — indicators such as CAPE at 40.6 are not a useful timing tool, but they are a condition for caution.
- Recognize your own emotional biases, especially FOMO and overconfidence.
- Diversification across sectors and asset classes reduces, but does not eliminate, risk — when all the “big” stocks are linked to common customers and circular deals, diversification weakens.
- Herding behavior is often stronger than rational analysis at market peaks.
- Position management and loss limits (stop-loss) protect capital during periods of reversal.
- The timing of entry into a bubble is rarely the biggest mistake — delayed exit is.
- Market history repeats itself with remarkable consistency: knowledge of the bubbles of the past — and monitoring indicators such as CAPE and margin debt — is the best prevention tool.
“Every proponent of speculative delusion in history claimed that the rules had changed; history, however, almost always proves the opposite” — a paraphrase of the well-known position of economic historian Charles P. Kindleberger, “Manias, Panics and Crashes”.
Market bubbles are not merely historical anomalies; they are a recurring feature of human collective psychology in the face of greed and fear. Recognizing the warning signs does not guarantee that an investor will avoid every crisis, but it significantly increases the chances of maintaining composure and preserving capital whenever the next bubble appears.
* Director of Research at Solidus Securities S.A., leads portfolio analysis and asset allocation optimization, developing comprehensive financial models for risk assessment and market trend forecasting. President of EEPAMA - HACSA.
** This article is for informational and educational purposes and does not constitute investment, tax, or legal advice. The data are indicative, based on publicly available historical data, and do not guarantee future returns. Before making any investment decision, consult a certified investment advisor.