The four major indices we examine -ASE General Index, Nasdaq Composite, DAX and Nikkei 225- are, each in their own way, at a mature stage of a long-term (secular) upward cycle, with monthly RSI at high levels and Elliott wave structures approaching or having already reached fifth-wave targets.
The interesting point is that this technical maturity coincides in time with a fundamental change in the macroeconomic landscape: after more than a decade of nearly zero cost of money, inflation has returned globally, central banks -Fed, ECB, Bank of Japan- have once again moved into a phase of rate increases, government bond yields are at multi-decade highs around the world, and the already enormous debts of states must be continuously refinanced in this new, more expensive environment.
In this article we combine the purely technical picture of each index with the key macroeconomic data of the respective economy.
The macroeconomic background
The Fed raised its key interest rate in September 2026 by 25 basis points, to 3.75%-4.00% — the first increase since 2023 — as PCE inflation rose from 3.0% in December 2025 to 3.3% in July 2026, with the main catalyst being the surge in the price of oil (WTI from about $57 at the beginning of 2026 to over $100).
Fed chairman Kevin Warsh stressed that “far too many categories continue to record increases above 3%”, paving the way for at least one more increase within 2026.
In Japan, the BoJ raised its interest rate to 1% in June 2026 — the highest since 1995 — with core inflation above the 2% target and the yen under continuous pressure. In the Eurozone, inflation reached 3.3%-3.4% in August 2026, mainly due to an energy supply shock, with the ECB having already raised rates to 2.25% in June and markets expecting an increase to 2.50% during September.
Three different central banks, three different economies, one common direction: the cost of money is rising again, after more than a decade of cheap financing that fueled precisely the secular bull markets we analyze below.
Bond yield surge
The change in stance by central banks was immediately transmitted to the bond markets. In the US, the 10-year yield reached 5% again after the Fed's rate hike, with Warsh warning of increased inflationary risks.
In Europe, government bond yields reached 15-year highs: the German 10-year Bund exceeded 3.36% (the 30-year 3.84%, the highest since 2011), the French 10-year OAT rose above 4.215% (higher than in November 2008, with France considered by analysts “the Eurozone country with the most unsustainable fiscal profile”), the Italian to 4.19% and the Dutch to 3.43% (higher than in 2011).
In Japan, the yield on the 10-year JGB reached the highest level since 1996, as markets price in further rate hikes by the BoJ on top of an already heavy fiscal backdrop.
Macroeconomic data and debt in the major economies
September 2026 data. Bond yields and interest rates change daily.| Country / Zone | 10-year bond | Central Bank Rate | Debt / GDP |
|---|
| US | ~5.0% (15-year high) | Fed 3.75%-4.00% | ~123% ($40.2 tn) |
| Germany | >3.36% (30-year: 3.84%) | ECB 2.25%-2.50% | ~63% |
| France | >4.215% (high since 2008) | ECB 2.25%-2.50% | →120.5% (est. 2027) |
| Italy | ~4.19% | ECB 2.25%-2.50% | ~137% |
| Japan | Highest since 1996 | BoJ 1.00% | ~249% |
| Greece | indirectly via ECB/spread | ECB 2.25%-2.50% | ~141%e (downward trend) |
| SOURCE: Fed, ECB, BoJ, Bloomberg, Trading Economics, BoG | PROCESSING: Euro2day.gr |
The weight of debt
The critical point is not only that yields are rising, but that they are rising on top of historically high levels of public debt, which must be continuously refinanced. US debt reached $40.2 tn in August 2026 (about 123% of GDP), with its servicing cost now exceeding $1 tn annually — higher even than the country's defense spending.
Japan maintains the highest debt-to-GDP ratio in the developed world, around 249%, precisely at the moment when the BoJ is abandoning the zero-interest-rate policy that had kept servicing costs manageable for decades.
In the Eurozone, France is projected to reach 120.5% of GDP by 2027 with a deficit around 5.2%, while even Greece, despite the steadily declining path of its debt (from 164% in 2023 to an estimated ~141% in 2026), remains indirectly exposed to the Eurozone's borrowing costs through the ECB.
The pattern is common in all cases: the higher the debt stock, the greater the sensitivity of the state budget to each additional basis point of yield — and the “cheap money” of the 2009-2021 decade, which allowed almost unlimited refinancing at minimal cost, is now over.
Secular bull and bear markets
Before moving on to the analysis of each index, it is worth clarifying what we mean by the terms secular bull and secular bear market, as they are often used loosely. A secular (long-term) bull or bear market is not the same as a simple upward or downward cycle of a few months or even 1-2 years (this is called a cyclical bull/bear, and appears as a smaller fluctuation within a secular wave — see the intermediate cyclical bear phases of 2018 and 2020, 2022 in the Nasdaq above).
A secular market describes a multi-year, structural trend — usually 9 to 24 years — in which the market either rises persistently, with corrections being short and shallow (secular bull), or moves sideways or downward for a long period, with upward moves being temporary and ending lower (secular bear).
Transitions from one phase to another are usually accompanied by fundamental changes in valuation levels (e.g. CAPE ratio), in the cost of money and in the macroeconomic environment — precisely the factors we examine in this article.
The strictest historical documentation comes from studies on the S&P 500 from 1929 onward, using dating methodologies such as the Bry-Boschan method, which objectively identify the turning points between cycles:
Historical Secular Bull & Bear cycles in the S&P 500 (1929-2026)
Duration and classification of phases based on the Bry-Boschan methodology| Period (S&P 500) | Duration | Phase |
|---|
| 1929-1942 | 13 years | Secular Bear |
| 1942-1966 | 24 years | Secular Bull |
| 1966-1982 | 16 years | Secular Bear |
| 1982-2000 | 18 years | Secular Bull |
| 2000-2009 | 9 years | Secular Bear |
| 2009-today (2026) | ~17 years | Secular Bull |
| SOURCES: Bry-Boschan cycle dating studies, S&P Dow Jones Indices | PROCESSING: Euro2day |
According to this historical record, the average duration of a secular bull market is about 19-20 years, while that of a secular bear market is about 12-13 years — although there is significant dispersion around these averages.
A frequently cited empirical “rule-of-thumb” estimate speaks of a range of 16-18 years per phase, while stricter studies using the Bry-Boschan methodology give a median duration of around 10-13 years.
The current secular bull market of the S&P 500, which began in 2009, is already in its 17th year — therefore, based on this historical framework, it is at a relatively mature stage compared with most previous cycles, without of course meaning that it must end immediately — only that the statistical “probability of maturity” increases as time passes, especially in combination with the valuation level and the macroeconomic environment described above.
Stock market: Exposure to the ECB
The Athens Stock Exchange General Index has completed a full cycle: secular bull market 1987-2000 (peak at 6,484 points in 1999), followed by a deep secular bear market 1999-2016, with a decline of more than 90% at the period low.
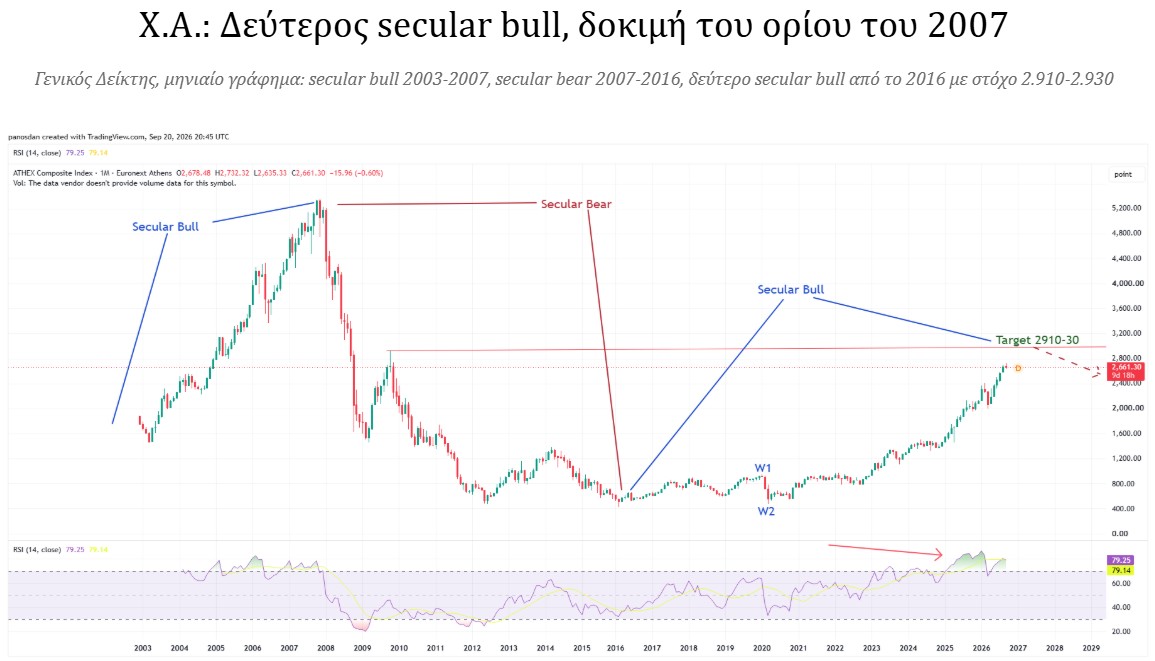
Since 2016 we have been in a second secular bull market, with wave 1 completing around 2020 and wave 2 corresponding to the pandemic correction. The subsequent upward move has brought the index to 2,661.30 points today, with monthly RSI at 79.25 — a clearly overbought level on a monthly basis, something that happens rarely.
The technical target is placed in the 2,910-2,930 zone, which coincides almost exactly with the level from which the major decline of 2007-2009 began — that is, the index is approaching a 19-year resistance zone.
At the macroeconomic level, Greece maintains a growth rate of around 1.9%-2.1% for the 2026-2028 period, higher than the Eurozone average, with debt on a downward path — elements that support the narrative, but which coexist with the fact that the Greek market remains exposed to the ECB's interest-rate policy and to a less generous framework of European financing after 2026.
Nasdaq: Fifth wave
The Nasdaq Composite is in one of the largest secular bull markets in history, which began from its 2009 low after the 2000-2009 secular bear market (the dot-com collapse and the Global Financial Crisis). Within this upward wave there have been 3 significant cyclical bear phases — the 2018 correction, the pandemic bear market and the 2022 bear market due to aggressive Fed rate hikes — without, however, overturning the basic upward structure.
The index is trading today at 26,522.55 points, with monthly RSI at 69.76, strong but not yet at extremely overbought levels. The technical fifth-wave target is placed at 31,720 points.
The question is whether the market will manage to “run” toward that target before the higher cost of money (Fed at 3.75%-4.00%, with one more increase expected) begins to materially compress the valuation multiples of the technology companies that dominate the index — especially those that financed their huge investments in AI infrastructure with cheap borrowing from the previous decade.
DAX: Signs of fatigue
The German DAX follows a similar five-part Elliott structure from 2009: wave 1 (2009-2011), wave 2 (2011-2012 correction), a series of cyclical bear markets in between (2015-2016, 2018, the pandemic collapse in 2020), wave 3 (the strong upward move 2011-2022) and an extended wave 5 in progress up to today.
The index is trading at 25,304.06 points, after a recent decline of 3.63% (-954.05 points), with monthly RSI at 63.61 (from a monthly high of 72.07) — a first indication of loss of momentum at the top of the fifth wave. Unlike the Nasdaq, the technical scenario here projects a possible decline toward the ~22,400-point zone after the completion of wave 5.
Germany's macroeconomic landscape reinforces this caution: German bond yields are at 15-year highs, German industry remains exposed to high energy costs, and the ECB has moved into a phase of increasing the cost of money precisely at the moment when the German economy is already showing signs of fatigue.
Nikkei 225: Change of era
The Nikkei 225 offers the most extreme historical example: a secular bull market in 1974-1989 that ended in the famous Japanese economy “real estate bubble” (wave 1), followed by one of the largest secular bear markets in modern financial history — the “lost decades” of 1990-2009 (wave 2), during which the index lost more than 80% of its value.
Since 2009 we have been in a new secular bull market, with wave 3 completing around 2024 and wave 5 in progress up to recent historic highs. The index is trading today at 65,018.95 points, with monthly RSI at 67.20 (from a high of 72.44), and the technical scenario projects a possible correction after the peak of this fifth wave.
The macroeconomic backdrop here is perhaps the most critical of the four indices: the BoJ abandoned in 2026 a policy of near-zero interest rates that had lasted for decades, raising its rate to 1% (the highest since 1995) on top of a state with the highest debt-to-GDP ratio in the developed world (~249%). The Japanese stock market had been rising in recent years partly because the yen was weak and the cost of money was zero; both of these conditions are now changing simultaneously.
The common thread
The interesting element is not simply that all four indices are at a mature stage of a secular bull market or fifth Elliott wave — it is that this is happening at the exact same time when, for the first time since the Global Financial Crisis, the world's three largest central banks (Fed, ECB, BoJ) are moving simultaneously toward tightening their monetary policy instead of easing.
The stock markets analyzed above were built, to a large extent, on an assumption of cheap money and easy refinancing of debt -sovereign and corporate- that held almost uninterruptedly from 2009 to 2021. That assumption no longer holds.
The question posed technically for each index -that is, whether the fifth-wave target will be completed first before the market reacts to more expensive money, or whether the reaction will come first- is essentially the same question expressed in technical terms: how much an upward structure can withstand when the cost of capital that supported it changes direction.
Limits of the analysis
This analysis is purely technical, based on Elliott wave counting on monthly charts, supplemented with macroeconomic data to provide context — it does not constitute investment advice. Wave counting is by definition subjective: different analysts can legitimately arrive at different numbering on the exact same chart, and the price targets mentioned (2,910-2,930 for the General Index, 31,720 for the Nasdaq, zone ~22,400 for the DAX after the peak) are probability projections, not certainties.
Macroeconomic data (interest rates, bond yields, inflation, debt/GDP) change frequently and may already have changed since the time of writing; they reflect the level of September 2026.
Finally, the analysis does not take into account geopolitical factors or extraordinary events that could overturn both the technical and macroeconomic picture from one day to the next.
* Director of Research at Solidus Securities SA, leads portfolio analysis and asset allocation optimization, developing integrated financial models for risk assessment and market trend forecasting. President of President EEPAMA - HACSA.
** This article is for informational and educational purposes and does not constitute investment, tax, or legal advice. The data are indicative, based on publicly available historical data, and do not guarantee future returns. Before making any investment decision, consult a certified investment advisor.