Every time a new valuation report is issued for a listed company, we see the same pattern of misunderstanding repeated — and not only by retail investors. An analyst gives a Buy recommendation with a target price of 15 euros for a stock trading at 11 euros, and in the following days we see questions like “why hasn’t the stock gone there yet, why isn’t the stock rising?”. Conversely, a stock with a Hold recommendation rises 8% within a week and we hear “but didn’t the analyst say not to buy?”.
Other times the problem is not even the reader’s misunderstanding, but the analysis itself: estimates appear that do not explain the methodology they use, only the final conclusion or the target price, as if it were a revelation and not a number resulting from specific assumptions.
And there are also estimates from amateurs, as usually happens during periods of bull market — and especially in the age of social media, where influencers of every kind and specialty flourish, writing confidently about stocks, without special training and without ever explaining how what they say is derived. All these questions and all these practices are ultimately based on misunderstandings — or omissions — that are worth clarifying.
The target price is not a forecast for “tomorrow”
When a report comes out or an analyst writes “Buy, target price 15 euros,” what they mean is: based on the data we have today, we estimate that over a 12-month horizon the fair price of the stock will be 15 euros. It is not a forecast for next week’s price, nor a commitment that it will get there in a straight line.
A stock may reach the target price in two months, exceed it and then retreat, or it may need 18 months instead of 12 — and in none of these cases was the original recommendation “wrong” in the sense people usually think.
The target price is essentially the result of a model (discounted cash flows, comparable company multiples, sum-of-parts, etc.) applied to a set of assumptions: revenue growth rate, profit margins, cost of capital, interest rate levels. If these assumptions change — either because the company’s fundamentals change or because the broader environment changes (interest rates, sector multiples, macroeconomics) — the target price changes as well, often before the original 12-month horizon is even completed.
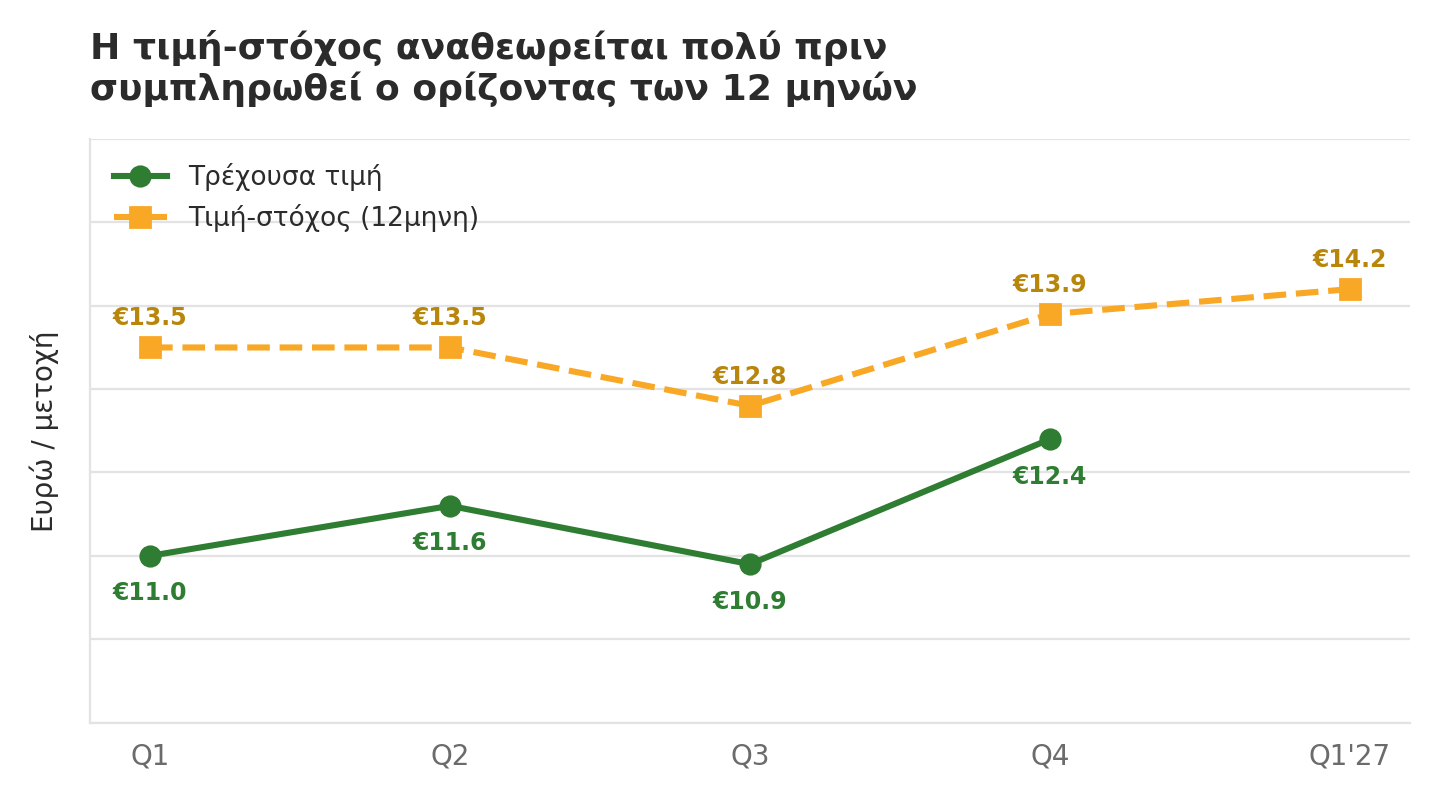
Illustrative example: the target price is adjusted every quarter, as assumptions change — it is not a fixed 12-month “finish line”.
Target price and fair value are not the same thing
This is where the second, subtler misunderstanding lies, one we often encounter even among more experienced report readers. Fair value is what a stock is “worth” today, based on its fundamental figures, without reference to a specific time horizon.
The target price is where the analyst estimates the price will be in 12 months, usually incorporating an expected convergence toward that fair value, but also anything else expected to change in the meantime (new earnings, dividends, change in net debt).
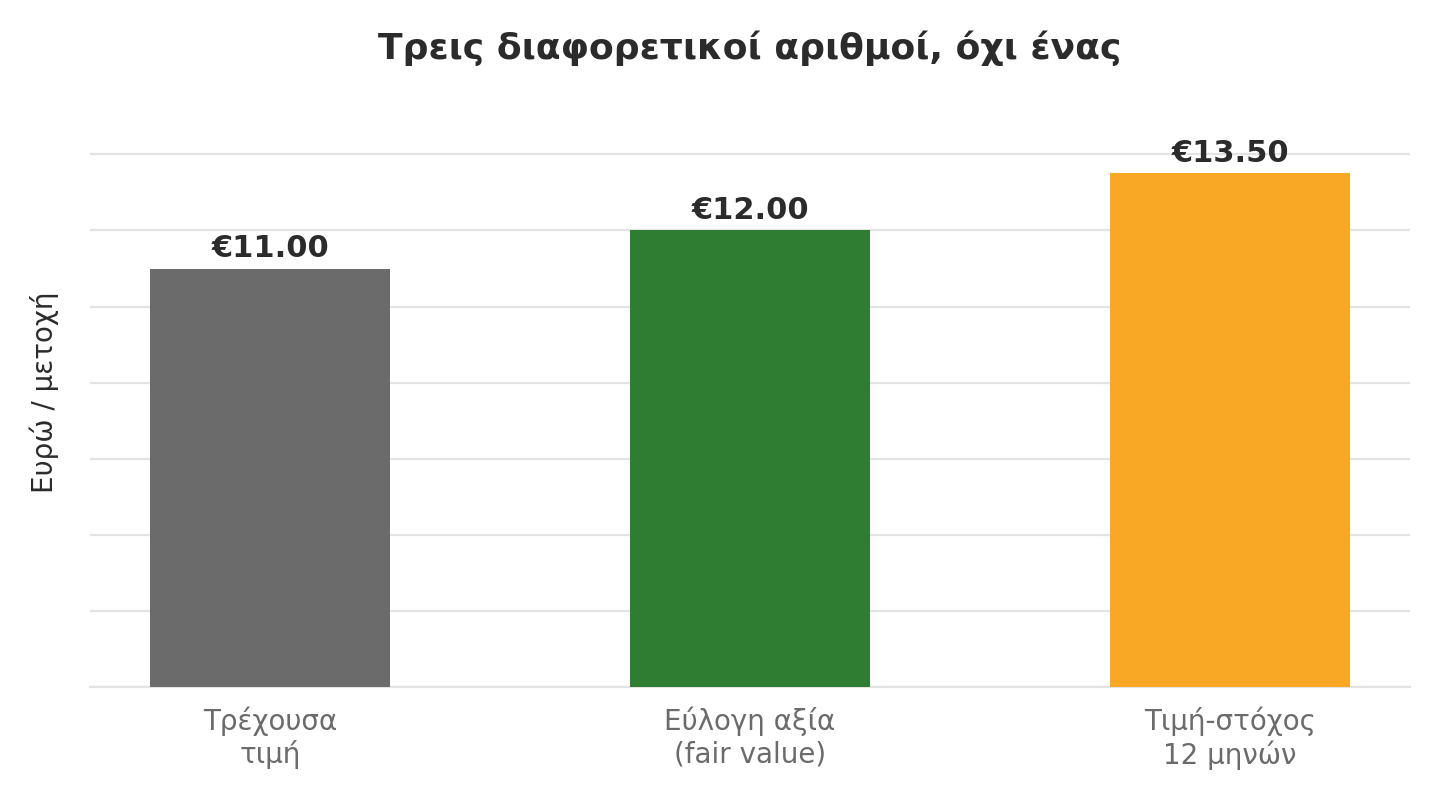
In practice, the two numbers often differ noticeably. A stock may have a fair value of 12 euros today, but a target price of 13.50 euros in 12 months, because the analyst discounts that during the year the company will generate additional earnings that will increase its intrinsic value.
The reverse is also true: a stock may already be trading very close to its fair value, so the 12-month target price may not be far from the current price — and that does not mean the analysis is “uninteresting,” it means the stock is already correctly valued.
Current price, fair value and target price are three different figures — they may coincide, but usually they do not.
Why a stock with a Hold recommendation can rise
This also explains the second, more common question: why a stock with a Hold recommendation (or Neutral, depending on each firm’s house style) continues to rise on the board. The recommendation is not a judgment on the company’s “quality,” it is a judgment on the risk-return relationship between the current price and the target price.
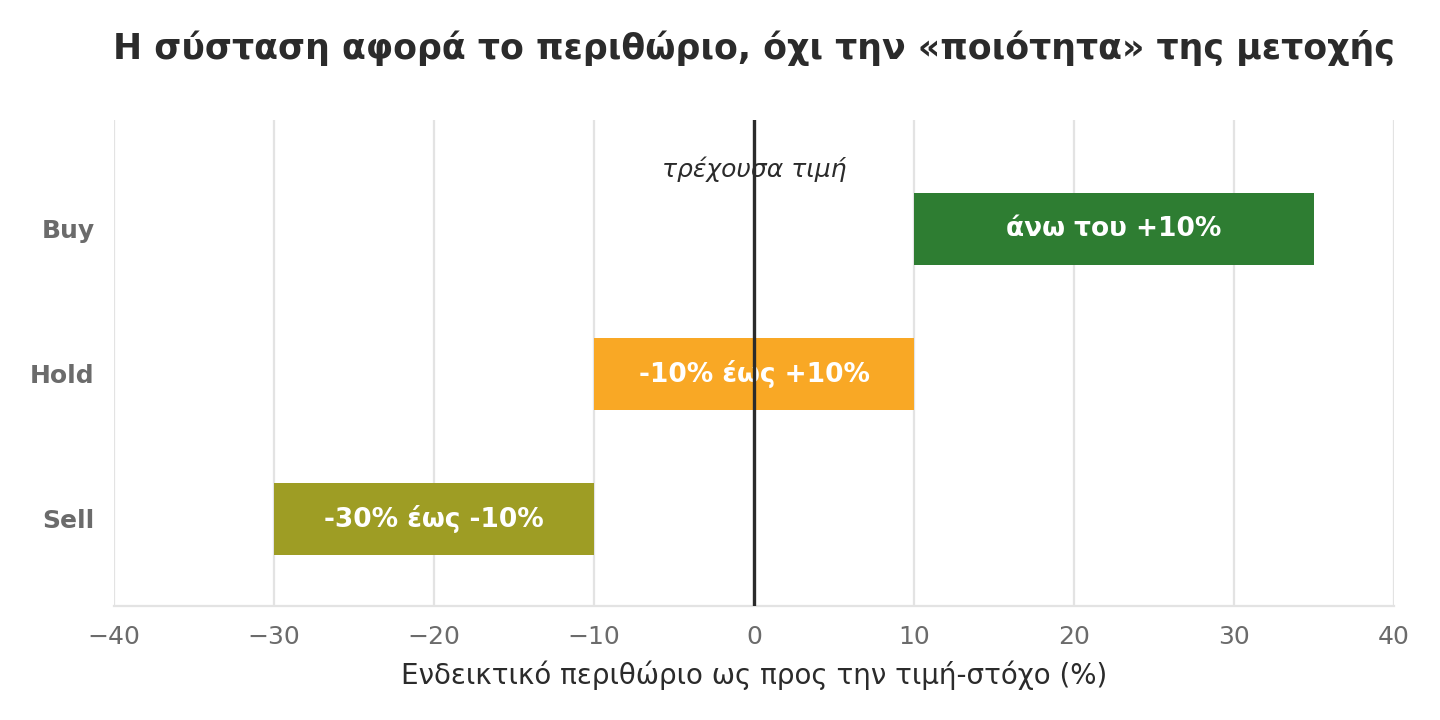
A Hold means, broadly speaking, that the upside margin toward the target price is not large enough to justify a new position relative to the risk one takes on — usually a range below 10%-15% upside (or even downside), depending on each house’s methodology.
But if the market as a whole is rising, or if better-than-expected results are released, or if investors’ risk appetite for the specific sector changes, the price may very well move upward without invalidating the recommendation — it simply means that the upside margin toward the (possibly revised upward) target price remains limited.
Conversely, a Buy can “lose” and the stock may decline, without that meaning the original analysis was wrong — something may simply have changed in the meantime (macroeconomic environment, sector developments) that was not known at the time of the recommendation.
Indicative margin ranges by recommendation — the exact limits differ from house to house, but the logic is common: the recommendation expresses the margin relative to the target price, not an independent judgment on the stock.
What really matters in a recommendation
To read a valuation report correctly, it is worth focusing on three points, not only on the “Buy/Hold/Sell” and the target price number.
First, the methodology used — whether it is based on discounted cash flows (DCF), comparable company multiples, adjusted net asset value, or a combination of these, because each method has different sensitivity to different assumptions.
Second, the key assumptions behind the number — what growth rate, what cost of capital, what long-term profit margin the analyst has assumed. Two reports may arrive at a similar target price with completely different logic, and vice versa.
Third, the date and context of the report. A recommendation given six months ago, in a different macroeconomic environment or before an earnings announcement, does not carry the same weight as a recent revision.
A real example: Aegean and National Bank
The differences we described are better seen in two recent examples from the Greek market — one company where the target price gap remains large, and one systemic bank where the recommendation is based not only on the price increase.
Comparative table of valuations and recommendations| Stock | Current price | Target price | Recommendation | Margin |
|---|
| Aegean Airlines (ARAIG) | €11,04 | €15,00 | Buy | ~+36% |
| National Bank (ETE) | €17,50 | €18,90 | Buy | ~+8% (+ dividend) |
For Aegean Airlines, we had given a Buy recommendation with a target price of 15 euros a few days ago, with the stock considerably lower. Today it is trading between 11 – 11.5 euros, meaning the target price still leaves about 36% upside from price movement alone. Aegean also pays a significant dividend, so the total expected return (price plus dividend) is even higher than the already large target price margin. It is a “clean” Buy example: a large gap between current price and estimated fair value, further enhanced by dividend yield, without any event having intervened to overturn the original assumptions of the analysis — the recommendation remains in force precisely because the gap has not yet closed.
For National Bank, the stock is trading at 17.50 euros with a target price of 18.90 euros, meaning a margin of about 8% from price movement alone. Nevertheless, the recommendation remains Buy, because in banks (and more generally in stocks with significant dividend yield) the recommendation is based on total expected return — price plus dividend — and not only on price appreciation. A dividend in the range of 4%-5% is added to the price margin, lifting total expected return above the threshold that justifies a Buy. This is also another reason why two stocks with a similar percentage upside to the target price may have different recommendations: one pays a significant dividend, the other does not, or the risk levels of the two sectors differ.
When a Hold declines: the weight of debt
There is also a more difficult version of Hold, which is worth distinguishing from the “normal” case where the stock simply moves sideways. Let us assume a listed company with significant bank borrowing — net debt several times its operating earnings (EBITDA) — a Hold recommendation and a target price slightly above the current price. In this case, two developments can “break” the balance downward, without anything having changed in the company’s revenues or operating performance:
First, a downward revision of management guidance — e.g. a lower target for EBITDA or profit margins. Such a development directly reduces estimated future cash flows, and therefore the valuation, even if the results already announced have not changed.
Second, a rise in interest rates, which in a highly leveraged company has a double negative effect: it increases the cost of servicing debt — thus reducing net earnings per share, as a larger portion of operating profits is absorbed by interest — and at the same time raises the discount rate (WACC) used in valuation, reducing the present value of future cash flows.
In such cases, Hold is not a “neutral” or uninteresting recommendation — it is a recommendation with asymmetric downside risk, which depends less on the company’s own operating performance and more on two exogenous factors: monetary policy and management credibility in the estimates it gives to the market.
ELPE and Motor Oil: when the key assumption changes
The refining sector clearly shows how sensitive a target price can be to a single variable. A few months ago we had given Motor Oil (MOH) a target price in the 65-70 euro range, with key assumptions of a specific level of international refining margins (crack spreads) and oil prices. The stock is trading at 65-67 euros, that is, within this range — which does not mean that the target price “stayed the same” by chance, but that the original assumptions have not yet been overturned.
The same applies to ELPE (HELLENiQ Energy), which is trading at 17-18 euros: both companies have valuations that depend to a large extent on one exogenous variable, the price of oil and refining margins. If the price of oil rises significantly, the cost of raw materials increases, but refining margins usually also rise with some time lag, so the net effect on earnings is not obvious in advance. If, on the contrary, the price of oil falls sharply, refineries’ raw material inventories are valued lower (inventory losses), something that may weigh on the accounting profits of a quarter without anything having changed in the company’s operating capability.
In both cases, a target price given with a specific assumption for oil needs revision if that assumption is disproved — regardless of how correct the rest of the analysis was. This is the point that is often overlooked when someone reads only the final number of a report: the target price does not “stand” on its own, it stands on one or two critical assumptions, and whoever monitors them knows when it is worth expecting a revision, even before it is published.
The limits of the methodology itself
It is worth being clear about one more thing: everything we described above arises through fundamental analysis — that is, models based on figures such as revenues, margins, cash flows, debt and cost of capital. And fundamental data are not fixed; they change from quarter to quarter, from announcement to announcement, depending on how the business and its sector actually evolve.
In the same logic, a large part of valuation is based on the guidance given by the company’s own management for the coming quarters or years — targets for revenues, margins, investments, dividend policy. This guidance is revised quite often, either upward (when the company outperforms relative to its original targets) or downward (when difficulties appear that were not visible earlier). Every such revision is transferred almost automatically into the valuation model, and therefore into the target price.
All of the above concern exclusively fundamental analysis, without taking technical analysis into account at all — that is, the study of the price and trading volume chart (trends, support/resistance, Elliott wave analysis, technical indicators). Technical analysis can be used complementarily, mainly for the timing of a move (when the market starts to “run” or correct), but it does not replace the fundamental picture, nor does it operate independently of it.
Technical analysis, however, is not an exact science either; it is more of an art and essentially it too is an estimate, based on its own assumptions, which are worth being known to anyone who uses it:
- that the current price already incorporates all available information, so the chart itself “suffices” for analysis;
- that history tends to repeat itself, meaning that price patterns and behaviors that have appeared in the past have an increased probability of recurring;
- that prices move in trends, and that a trend in progress has a greater probability of continuing than reversing;
- that trading volume confirms (or challenges) the strength of a price move;
- that support and resistance levels, as well as Elliott wave counting, are zones of probability and not exact, mathematically strict lines — different analysts can legitimately arrive at different counts or different levels on the exact same chart.
In other words, both fundamental and technical analysis are estimation tools based on assumptions — not certainty forecasts. Their difference is that they rely on different kinds of data (financial figures in one case, price-volume behavior in the other), and precisely for this reason they can function complementarily, without either of them offering certainty.
The interesting thing is that this confusion does not concern only retail investors. Even professionals who follow the market daily, when they step outside their narrow field of specialization, tend to treat the target price like a “finish line” and the recommendation like a verdict on whether a stock is “good” or “bad” — while in reality it is a dynamic tool that changes with every new piece of information, and that only makes sense in combination with the time horizon, methodology and assumptions on which it was based.
* Director of Research at Solidus Securities SA, he guides portfolio analysis and asset allocation optimization, developing integrated financial models for risk assessment and market trend forecasting. President of the President EEPAMA - HACSA.
** This article is for informational and educational purposes and does not constitute investment, tax, or legal advice. The figures are indicative, based on publicly available historical data, and do not guarantee future returns. Before making any investment decision, consult a certified investment advisor.