Credit default swaps (CDS) on companies financing the AI boom have hit record highs this year. We believe the signal warrants attention, but should not be read as a prediction of default: it shows that bondholders are now demanding a much higher price to finance an investment programme that increasingly relies on borrowing.
A CDS is a contract under which the buyer pays a regular premium in return for compensation if the issuer of a bond fails to service its debt. In other words, it insures the bond or loan, not the shares. It covers credit events such as non-payment, bankruptcy or restructuring.
The spread is quoted in basis points (bp) and is easy to interpret: at 212bp, insuring $10m of Oracle debt costs $212,000 a year. Levels above 1,000bp are generally considered a sign of credit distress. A wide spread does not mean an imminent default: it also includes a risk and liquidity premium, which is why “default probabilities” derived mechanically from the spread (for example, 63% for CoreWeave) overstate the actual likelihood.
The corporate CDS picture
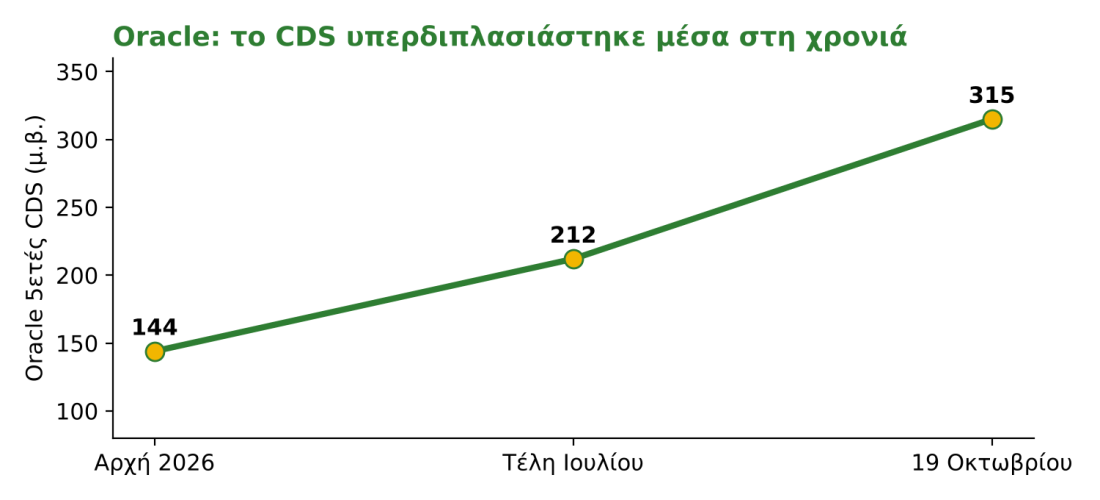
Oracle’s five-year CDS rose from 144bp at the start of the year to 203bp, its highest level since the 2008 crisis, and was trading at around 315bp on 19 October, up 311% in a year. Sources report different levels for different dates because the market is thinly traded. CoreWeave, the AI industry’s “canary in the coal mine”, is trading in the 1,100bp range, with its bond yield at 15%.
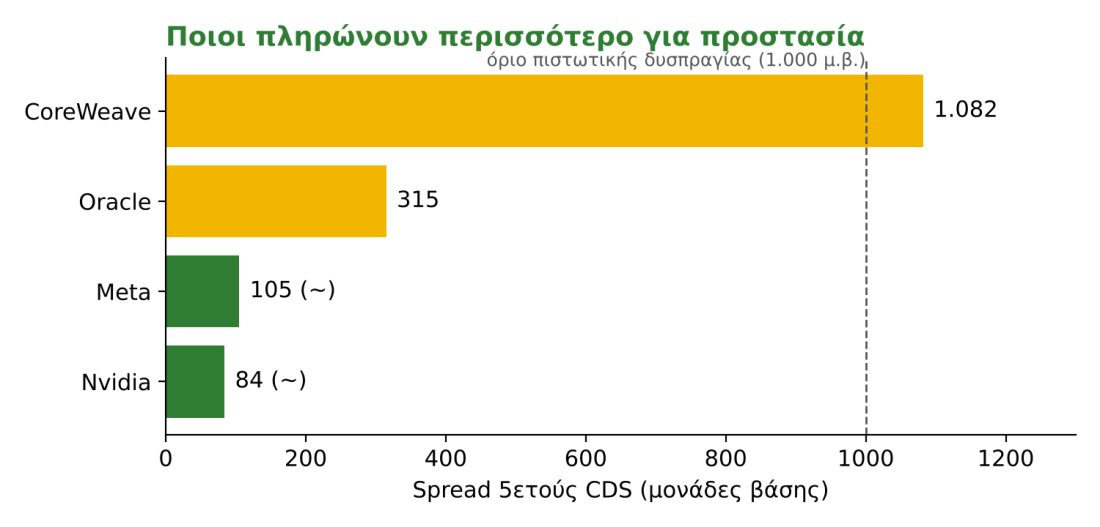
| Company | 5-year CDS (bp) | Source, date | Comment |
|---|
| Oracle | ~315 | CNBC, 19/10 | +311% in a year; BBB- |
| CoreWeave | ~1.082 | CNBC, 19/10 | Distress level |
| Meta | ~105 | Dealroom, October | Low in absolute terms |
| Nvidia | 80–87 | Market analysis, October | Within range |
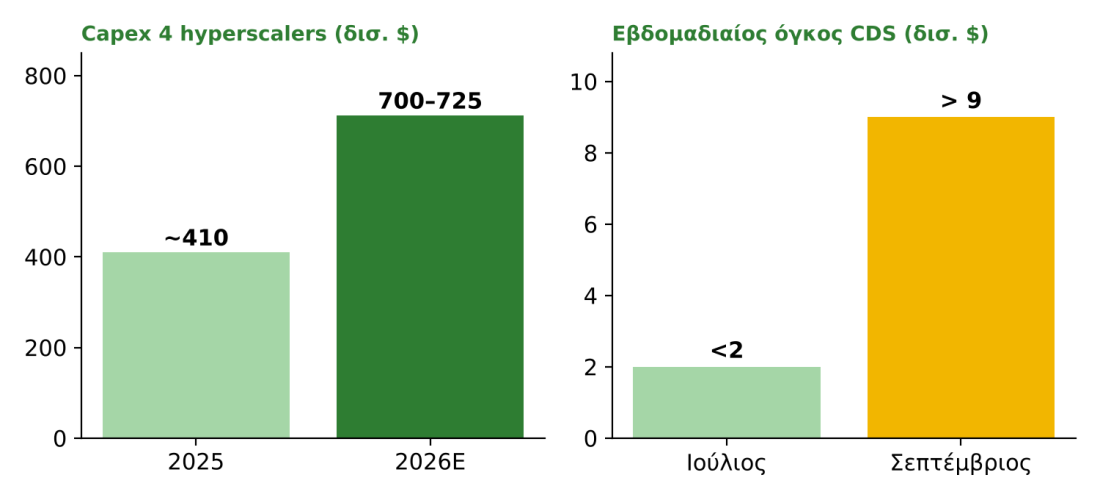
Demand for protection has also surged. In September, more than $9bn a week in CDS on seven AI names (Oracle, SpaceX, Alphabet, Amazon, Meta, Broadcom and Nvidia) changed hands, up from less than $2bn in July, according to Morgan Stanley. JPMorgan launched a dedicated CDS basket for five hyperscalers in February, while total net notional in major technology names reached a record $12.5bn.
Investment funded by borrowing. Apollo economist Torsten Slok argues that the market is repricing the fundamentals of hyperscalers: a debt-funded capex cycle involving rising leverage, negative free cash flow and uncertain returns on assets that depreciate quickly. The gap between hyperscaler and bank CDS has widened to around 60bp from roughly zero in October 2025.
The scale. 2026 will be the first year in which the five largest cloud providers’ capex exceeds their operating cash flow. Combined capex for the four largest is estimated at $700bn–$725bn, compared with around $410bn in 2025. Morgan Stanley expects AI-related debt issuance to roughly double, to $570bn.
Oracle is the most exposed name: negative free cash flow of $23.7bn in fiscal 2026, debt of around $130bn and a downgrade by S&P to BBB-, one notch above junk status. Meta, meanwhile, which reported better-than-expected results the day before yesterday and gave optimistic guidance, sold off because free cash flow (FCF) was -$2.12bn, against +$10.63bn in Q3 2025; its operating margin was 20%, versus 40% a year earlier; and long-term debt had nearly matched cash ($80.9bn versus $82.5bn).
Technical factors. The technology CDS market is narrow and thinly traded, which helps explain the sharp moves. Some demand comes from multi-asset and equity managers using CDS as a cheaper hedge than equity puts, rather than from a genuine prediction of default. Rising long-term yields — the US 30-year yield reached its highest level since 2004 — are adding further pressure to borrowing costs.
What investors are concerned about
- Repayment. Gartner estimates that data-centre owners must generate a cumulative $8.5trn in revenue by 2030 to cover capex, financing costs and a 12% return.
- Circular financing. Suppliers are financing customers who buy their products. Morgan Stanley estimates that hyperscalers, Nvidia and Broadcom have provided more than $3.1trn in guarantees, leases and other support to third parties. Howard Marks notes that chipmakers now have to subsidise their customers’ purchases, otherwise those purchases would not happen.
- Concentration. Rothschild describes a concentrated bet in which just two companies would generate enough revenue to support all the financing, citing Broadcom’s $42bn loan to Anthropic.
- Opacity and non-bank finance. The BIS warns that AI financing is increasingly channelled through hedge funds and private credit, and that a reversal could be highly painful. Deal terms are not fully disclosed, raising the risk that the same asset may have been pledged as collateral multiple times. The Bank of England’s Financial Policy Committee made a similar warning in September.
- Depreciating assets. Chips and servers have short useful lives, while the debt used to finance them has a longer maturity.
The picture is not one-sided. Demand for computing services is considered real: CoreWeave has contracts with all the major hyperscalers, and the problem is its debt structure, not demand. TSMC’s results show that demand remains strong.
Spreads remain low in absolute terms for most names, and it is unclear whether the large notionals reflect a bearish view or mechanical hedging against new debt issuance. Howard Marks also argues that the fact everyone is asking whether there is a bubble makes one less likely.
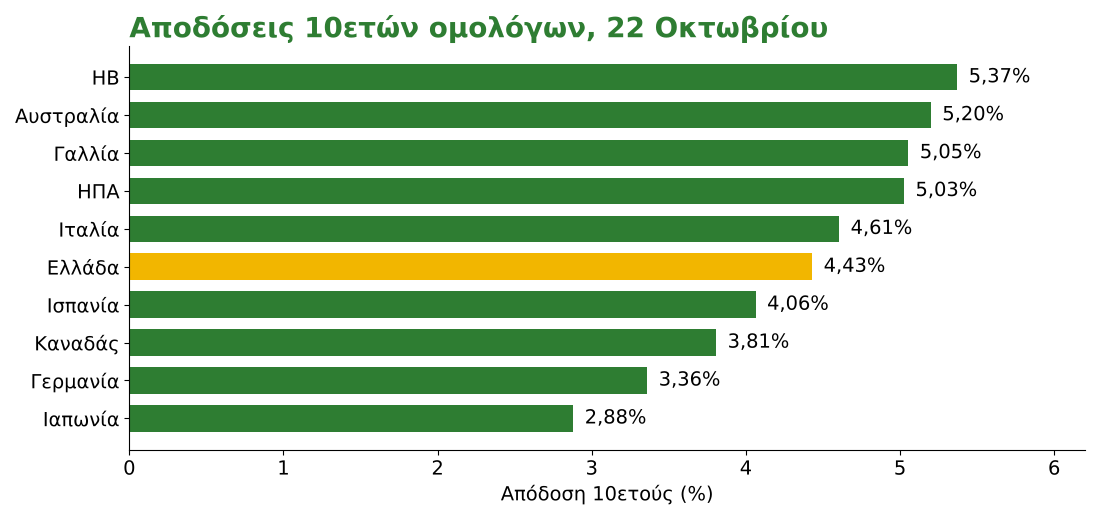
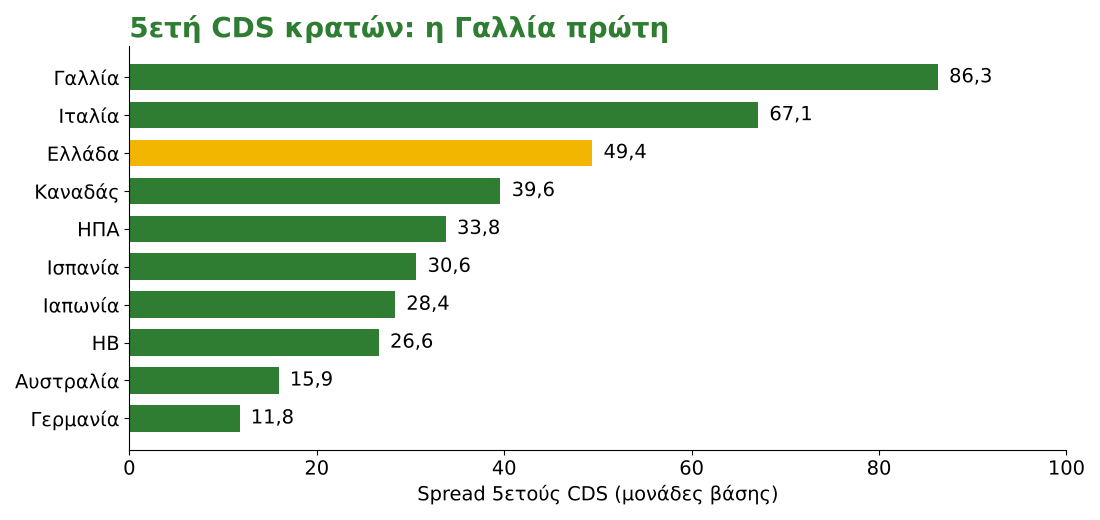
Borrowing pressure is not confined to AI companies. On 22 October, France’s five-year CDS was trading at 86.3bp, Italy’s at 67.1bp, Greece’s at 49.4bp and Germany’s at 11.8bp. Ten-year bond yields ranged from 2.88% in Japan to 5.37% in the UK, with the US at 5.03% and France at 5.05%. We believe these figures are worth considering alongside corporate CDS, because companies’ borrowing costs start with the government yield curve.
| Country | 10-year yield (%) | 5-year CDS (bp) | CDS change (1 month) |
|---|
| France | 5.05% | 86.3 | +82.8% |
| Italy | 4.61% | 67.1 | +71.4% |
| Greece | 4.43% | 49.4 | +47.9% |
| Canada | 3.81% | 39.6 | — |
| US | 5.03% | 33.8 | −8.3% |
| Spain | 4.06% | 30.6 | +38.6% |
| Japan | 2.88% | 28.4 | — |
| United Kingdom | 5.37% | 26.6 | +31.5% |
| Australia | 5.20% | 15.9 | −0.2% |
| Germany | 3.36% | 11.8 | +38.6% |
The next chart compares, in basis points, the rise in CDS and the rise in the 10-year yield over the past month. France shows the clearest link: the yield rose by 46bp and the CDS by around 39bp (+83%). In Italy, the CDS rose by 28bp (+71%), while the yield increased by 13bp; in Spain, the CDS rose by 9bp and the yield by 16bp. In Greece, the CDS rose by 16bp (+48%).
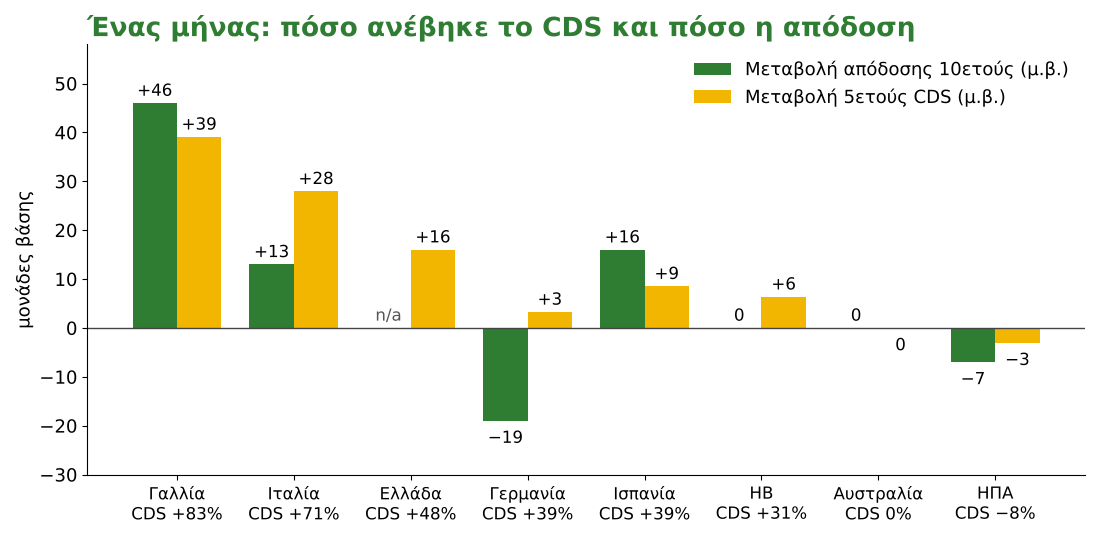
The relationship is not mechanical. In Germany, the yield fell by 19bp while the CDS rose by 3bp (+39%, from a very low base); in the US, the yield fell by 7bp and the CDS by 3bp. Yields in the UK and Australia were almost unchanged. The US has one of the highest yields in the table and one of the cheapest CDS (33.8bp). We believe CDS reflect each country’s credit risk, with fiscal risk most evident in France, rather than simply the level of interest rates. The percentage increase from a low base, as in Germany, looks larger than the actual change in basis points.
We believe the credit signal is valuable because bondholders focus on the ability to repay, not the growth narrative, and historically the CDS market has moved ahead of equities for issuers under pressure. The indicators we will be watching are hyperscalers’ free cash flow, Oracle and CoreWeave CDS, and whether spreads on Meta, Alphabet and Nvidia break out of their current ranges. If Oracle and newer debt issues continue to push up borrowing costs, the risk will spill over from credit spreads into equity valuations.
Sources:
CNBC, IFR Fortune, Dealroom (Morgan Stanley Research), FT/Bloomberg via AI Weekly, BIS, Annual Economic Report 2026, Bank of England, Financial Policy Committee, September 2026, Spinel Capital
Trading Economics (10-year yields, 22/10/2026), Bloomberg and Investing.com (sovereign CDS, 20-22/10/2026)
* Director of Research at Solidus Securities S.A.E.P.E.Y., leading portfolio analysis and asset allocation optimisation, and developing integrated financial models to assess risk and forecast market trends. President of EEΠAMA - HACSA.
** This article is for informational and educational purposes and does not constitute investment, tax or legal advice. The figures are indicative, based on publicly available historical data, and do not guarantee future returns. Consult a certified investment adviser before making any investment decision.