The nine-month results season is under way, and listed companies will publish their financial statements over the coming weeks. The headlines will be familiar: “profits up”, “record sales” and “margin pressure”. But retail investors do not read the results in the same way as institutional investors, and a proper reading goes beyond the first page of the press release.
Retail investors: Four key questions
First, how did revenue and operating profitability (EBITDA) perform compared with last year? Net profit is affected by taxes, depreciation and one-off items, while EBITDA gives a clearer picture of how the business is performing in practice. Second, is profit growth coming from the company’s core business or from a one-off event? A company that boosts profits by selling property is not the same as one that does so by winning more customers. Third, what happened to net debt: did it fall, or was growth financed through borrowing? Fourth, what is management saying about the rest of the year and the dividend?
Institutional investors: Earnings quality and cash flow
A portfolio worth hundreds of millions is not satisfied with simply seeing that “profits are up”. The first thing we focus on is the conversion of earnings into cash. If profits are rising but operating cash flow is lagging because inventories and receivables are swelling, the problem will show up on the balance sheet later.
Next come the EBITDA margin and how it is changing quarter by quarter, ROIC relative to the cost of capital, the net debt-to-EBITDA ratio, capital expenditure and its allocation, and the breakdown by business segment. Institutional investors also compare the figures with market consensus. A company may report 10% growth and its shares may fall because the market was expecting 15%.
Examples by sector
Banks
We do not look only at net profit. We look at net interest income, which (should) rise when the ECB raises interest rates, fee income, which shows how much less dependent a bank is on the interest-rate environment, the cost of risk, the non-performing loan ratio and capital adequacy. A bank with steady profits but weakening core interest-earning activity and one-off gains from its securities portfolio has lower-quality results than one with more modest growth but stronger organic performance.
Energy and refining
For refineries, the refining margin and inventory gains or losses (inventory effects) can change the picture completely. Accounting gains on inventories boost results when oil prices rise, but they are not recurring. That is why the market focuses on adjusted EBITDA.
Tourism and airlines
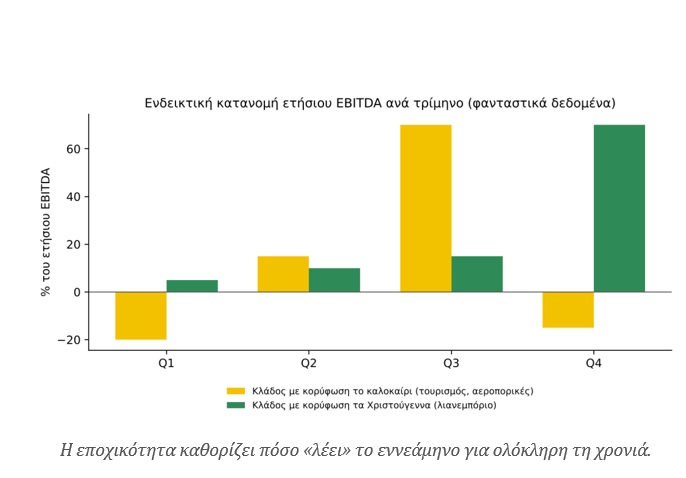
The third quarter is the peak of the year. An airline earns almost all its annual profit in the first nine months, while the fourth quarter usually ends in a loss. Anyone who multiplies nine-month results by 4/3 to “estimate” the full year will get it completely wrong.
Retail
The opposite is true here: Christmas and the sales period account for a disproportionately large share of annual profits in the final quarter. A lacklustre nine-month period does not necessarily mean a lacklustre year, while an exceptional one does not guarantee that targets will be met.
Industry and engineering companies
For metals, construction and infrastructure companies, the focus is on the order backlog and raw material prices, because these determine the quarters ahead, not the period just ended.
Telecommunications
This is a sector with stable revenue and low seasonality, so the focus shifts from growth to cash generation. We look at free cash flow after investment in networks and spectrum, how much of it covers dividends and share buyback programmes, and whether cost reductions (efficiency gains and the integration of operations) offset flat revenue.
A telecoms group with slight EBITDA growth but insufficient cash flow to fund its announced distribution policy is in a weaker position than its results headline suggests.
Property companies and REICs
Here, net profit can be misleading because it includes property revaluations, which are accounting entries rather than cash. A year of rising valuations inflates profits; a year of falling valuations reduces them, even if rents have not changed.
Investors look at rental income, portfolio occupancy, lease duration, the loan-to-value ratio (LTV), the cost of debt and distributable earnings. Comparing the current share price with net asset value (NAV) shows whether the market believes the valuations.
This season’s additional filter: The macroeconomic environment
Nine-month results relate to the past, but investors read them in the context of current conditions. With bond yields rising and markets expecting rate hikes from the ECB and the Fed, France’s risk premium at levels not seen since the eurozone debt crisis, and investment in artificial intelligence reaching hundreds of billions of dollars, three questions matter more than usual.
What is the cost of debt, and when will it be refinanced?
We examine interest expenses, the mix of fixed- and floating-rate debt, and the repayment schedule. A company with high debt and floating interest rates already has margins under pressure, while one with long maturities and fixed rates has more time. The interest coverage ratio (EBITDA divided by interest expense) shows how much headroom there is. Capital-intensive companies, such as those in infrastructure, energy and property, are the most exposed.
How do higher yields affect valuations?
Future earnings are discounted at a higher rate, so growth stocks and companies with cash flows further in the future are hit first. For REICs, the same effect puts pressure on property valuations and net asset value, as valuers’ discount rates rise.
For banks, the picture cuts both ways. Higher interest rates support net interest income but hurt bond portfolios, so we look at unrealised losses in equity and the cost of risk, as more expensive loans put borrowers to the test.
How exposed is the company to the French crisis?
For banks and insurers, we look at the value of French government bonds in their portfolios and their credit exposure to France. For industrial groups, the share of sales made in France matters, as does the risk that fiscal tightening will hit demand. The broader risk is contagion: when the spread of a large eurozone country widens, the cost of financing rises for others, too.
Artificial intelligence and investment spending
Beyond Euronext Athens, on overseas markets — particularly Wall Street, Xetra and Euronext — the big story is high-tech and AI companies. For these companies, the question is whether the vast sums invested in data centres and chips will translate into revenue and cash flow.
We look at the gap between capital expenditure and operating cash flow, how the investment is financed (through cash generation or debt, which costs more when interest rates are rising), the effect of depreciation on margins in the coming quarters, and demand indicators, namely cloud and AI revenue and the order backlog.
For Greek suppliers, the issue is different: cable makers, electrical equipment manufacturers and energy producers benefit from demand for infrastructure and electricity. Here, we look at the backlog, new contracts and orders.
Management’s language
In periods like this, conference calls with analysts often reveal more than the press release. We pay attention to what management says about financing costs, dividend and share buyback policies, investment plans that may be postponed, and whether it maintains or revises its guidance. A downgrade in this environment carries more weight than a bad quarter.
In summary:
| Factor | What to look for in the results | Sectors most affected |
|---|
| Rising interest rates and yields | Interest expenses, floating-rate debt, interest coverage, property valuations, unrealised losses on bonds | Property, infrastructure, energy, banks, highly indebted companies |
| French crisis | Exposure to French bonds, sales in France, financing costs | Banks, insurers, industrial companies with exposure to the French market |
| Investment in artificial intelligence | Capex versus cash flow, debt financing, depreciation, backlog and new contracts | Technology, cables and electrical equipment, energy |
Nine months or the full year?
A share price reflects expectations for the future, not the past. Nine-month results are useful as an indication of whether our investment thesis is being confirmed or disproved. They represent 75% of the year and usually account for most of the profits, but they are not the full year.
For institutional investors, three things matter. The first is the quarter on its own (Q3 in isolation), because cumulative figures can hide the latest trend: a company may report strong nine-month results even as growth slows in the third quarter, and that is what matters for the period ahead. The second is management’s guidance for the full year and any changes to it, because revisions to estimates move share prices more than the results themselves. The third is the comparison base: if the same period last year included one-off items, the year-on-year change can be misleading.
For the retail investor, the rule of thumb is simple. Nine-month results show whether the company is on track to meet its targets; the full-year results will show whether it did. Buy or sell decisions should not be based on a single figure or headline, but on whether the overall picture — profitability, cash, debt and outlook — is improving or deteriorating.
When results are announced, the best indicator is not the size of profit growth but its quality . The more recurring it is, the more firmly it is backed by cash and the more consistent it is with management’s strategy, the greater its value to investors.
* Director of Research at Solidus Securities AEPEY, overseeing portfolio analysis and asset allocation optimisation, and developing comprehensive financial models to assess risk and forecast market trends. President of EEPAMA - HACSA.
** This article is for informational and educational purposes only and does not constitute investment, tax or legal advice. The figures are indicative, based on publicly available historical data, and do not guarantee future returns. Before making any investment decision, consult a certified investment adviser.