Derivatives are contracts whose value depends on an underlying asset, such as a share, an index, an exchange rate or an interest rate. They serve three purposes: hedging, speculation and arbitrage.
The theory behind the four main categories, forwards, futures, options and swaps, is relatively straightforward. The challenge comes when you have to work out what you will gain or lose in a particular scenario.
In this article, we take each category and run through a numerical example with three or four price scenarios. All the figures are hypothetical and have been chosen to illustrate how the mechanics work. They do not reflect current market prices and exclude commissions and taxes.
Forwards and futures: locking in a price
Both contracts commit the parties to buy or sell an asset at a predetermined price on a future date. They differ in how they work.
| | Forward | Future |
|---|
| Where it trades | Over the counter (OTC) | On an exchange |
| Terms | Tailored to the parties’ needs | Standardised |
| Counterparty risk | Exists | Minimal, thanks to a clearing house |
| Settlement | At maturity | Daily, marked to market |
Example 1: Currency forward for an importer
Scenario: A Greek company will pay a supplier $2 million in six months. It is concerned that the euro may weaken. It agrees a forward contract with its bank at an exchange rate of $1.10 per euro.
The forward locks in the cost at 2,000,000 / 1.10 = €1,818,182, whatever happens in the market. The table shows what the cost would have been without the contract.
| Exchange rate in 6 months | Market cost | Cost with forward | Saving with forward |
|---|
| 1.00 | €2,000,000 | €1,818,182 | +€181,818 |
| 1.10 | €1,818,182 | €1,818,182 | €0 |
| 1.20 | €1,666,667 | €1,818,182 | −€151,515 |
The company did not “win” or “lose”. It bought certainty. In the third scenario, it would have paid less without the forward; that is the cost of hedging. The corresponding risk with a forward is the counterparty: if the bank fails to honour the contract, the protection is lost.
Example 2: Futures to hedge an equity portfolio
Scenario: An institutional investor manages a €10 million portfolio of Greek shares, with a beta of 1.3 to the FTSE/Athex Large Cap index. It wants protection for a few weeks without selling any securities. We assume the index is at 2,000 points and the multiplier is €5 per point, so each contract represents €10,000.
To hedge the entire position, it sells 1.3 × 10,000,000 / 10,000 = 1,300 futures contracts. The table shows the outcome under three index scenarios.
| Change in index | Portfolio | Futures (1,300 short) | Net result |
|---|
| −10% (1,800 points) | −€1,300,000 | +€1,300,000 | €0 |
| 0% (2,000 points) | €0 | €0 | €0 |
| +10% (2,200 points) | +€1,300,000 | −€1,300,000 | €0 |
The protection is complete and works both ways: the investor does not lose if the market falls, but does not gain if it rises either. If it had sold only 650 contracts, in the −10% scenario it would have lost 1,300,000 − 650,000 = €650,000, meaning it would have hedged half the risk. In practice, a hedge is never perfect because beta is not constant and the portfolio does not move exactly in line with the index.
Example 3: Daily marking to market and leverage
Scenario: We buy a single-stock future at €10.00, with 100 shares per contract, giving it a value of €1,000. The initial margin is hypothetically 15%, or €150.
| Day | Close | Price change | Daily profit / loss | Cumulative |
|---|
| 1 | €10.30 | +0.30 | +€30 | +€30 |
| 2 | €9.90 | −0.40 | −€40 | −€10 |
| 3 | €10.50 | +0.60 | +€60 | +€50 |
Profits or losses are credited to or debited from our account every day. If the account falls below the required threshold, a margin call is made. Leverage is clear when we compare the price movement with the capital we committed: a 10% rise in the share price generates €100, or 66.7% of the €150 margin. A 10% fall generates the same loss in the opposite direction, while a 15% fall wipes out the entire margin.
Options: buying a right, not an obligation
A call gives the buyer the right to buy the underlying asset at the strike price. A put gives the right to sell it. The buyer pays a premium and the seller (writer) receives it, taking on the obligation. This asymmetry creates outcomes that differ from simply buying a share.
Example 4: Long call, upside with limited risk
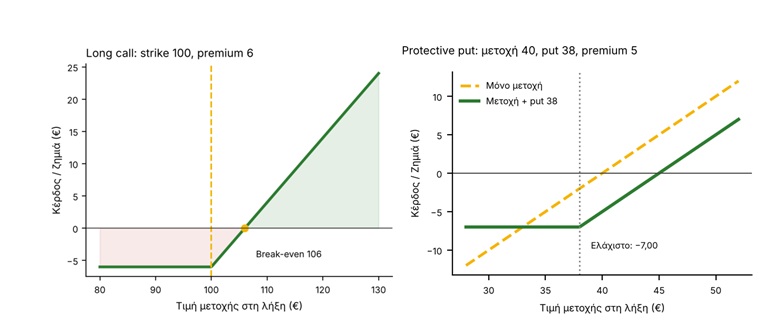
Scenario: A share is trading at €100. Instead of buying the share, we buy a call with a strike of 100 and a premium of €6 per share.
| Price at expiry | Profit on call per share | Return on premium | Return from buying the share |
|---|
| €90 | −€6 | −100% | −10% |
| €100 | −€6 | −100% | 0% |
| €106 | €0 | 0% | +6% |
| €120 | +€14 | +233% | +20% |
| €140 | +€34 | +567% | +40% |
The break-even point is the strike plus the premium, or €106. The maximum loss is the premium, whatever happens to the share price. The trade-off is that the call loses all the capital invested if the share does not rise above €106, while the share would have lost 10% in the worst-case scenario shown in the table.
Example 5: Protective put, insurance for a portfolio
Scenario: We own 1,000 shares priced at €40 (a portfolio worth €40,000). We are concerned about a short-term correction but do not want to sell. We buy 1,000 puts with a strike of 38 and a premium of €5, costing €5,000.
| Price at expiry | Shares | Put (after premium) | Net result |
|---|
| €30 | −€10,000 | +€3,000 | −€7,000 |
| €35 | −€5,000 | −€2,000 | −€7,000 |
| €38 | −€2,000 | −€5,000 | −€7,000 |
| €40 | €0 | −€5,000 | −€5,000 |
| €50 | +€10,000 | −€5,000 | +€5,000 |
The maximum loss is €7,000, or 17.5% of the portfolio’s value. Without the put, a fall to €30 would have cost 25%. If the share rises, we gain as usual, less the premium. The break-even point moves to €45. The logic is the same as property insurance: we pay a premium that is “lost” most of the time.
Example 6: Covered call, income from shares we already own
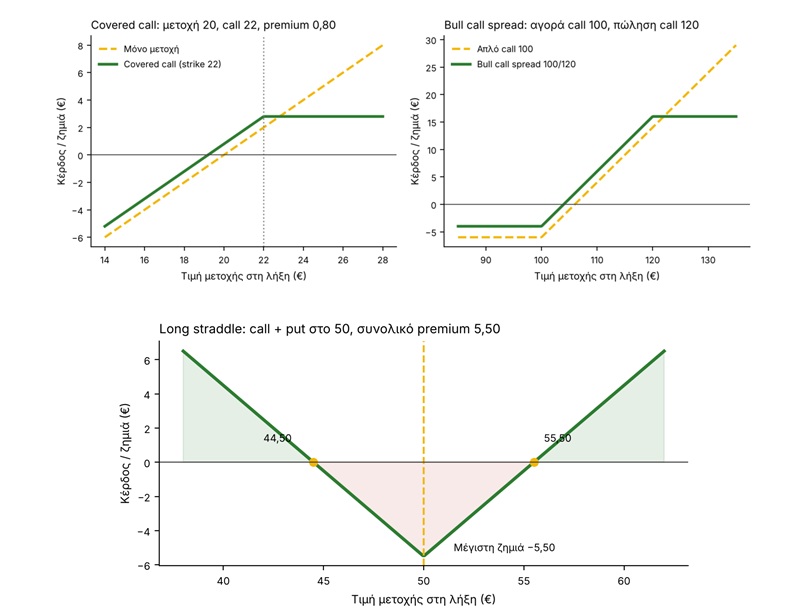
Scenario: We own 1,000 shares at €20 (€20,000) and do not expect a substantial rise. We sell 1,000 calls with a strike of 22 and receive a premium of €0.80, or €800.
| Price at expiry | Shares | Call sold (including premium) | Total | Shares only |
|---|
| €18 | −€2,000 | +€800 | −€1,200 | −€2,000 |
| €20 | €0 | +€800 | +€800 | €0 |
| €22 | +€2,000 | +€800 | +€2,800 | +€2,000 |
| €26 | +€6,000 | −€3,200 | +€2,800 | +€6,000 |
The premium acts as a cushion: the break-even point falls to €19.20. In a sideways or mildly rising market, the strategy earns €800 to €2,800, but the maximum gain is capped at €2,800 (14%). In the €26 scenario, we give up €3,200 of the gains from the rise, which is the strategy’s opportunity cost.
Example 7: Long straddle before an earnings announcement
Scenario: A share priced at €50 is due to report earnings, and we expect a sharp move but do not know in which direction. We buy a call with a strike of 50 (premium 3.00) and a put with a strike of 50 (premium 2.50), for a total of €5.50 per share.
| Price after announcement | Result per share | For 100 shares |
|---|
| €40 | +€4.50 | +€450 |
| €44.50 | €0 | €0 |
| €50 | −€5.50 | −€550 |
| €52 | −€3.50 | −€350 |
| €55.50 | €0 | €0 |
| €60 | +€4.50 | +€450 |
The strategy makes a profit only if the share moves by more than €5.50 in either direction, or about 11%. A 4% rise would result in a loss. The key question is whether the market has already priced in a large move through the premium.
Example 8: Bull call spread, a cheaper bullish position
Scenario: The share is at €100 and we expect a moderate rise. We buy a call with a strike of 100 (premium 6) and sell a call with a strike of 120 (premium 2). The net cost is €4.
| Price at expiry | Spread | Uncovered 100 call |
|---|
| €90 | −€4 | −€6 |
| €104 | €0 | −€2 |
| €110 | +€6 | +€4 |
| €120 | +€16 | +€14 |
| €140 | +€16 | +€34 |
The spread has a maximum loss of €4 and a maximum gain of €16, a 4-to-1 ratio, with a break-even point of €104. The simple call earns much more if the share rises sharply, but costs 50% more and needs to reach €106 to break even. The spread is the right choice when our expectations are measured.
The “Greeks”: how sensitive is an option?
An option’s price does not move solely with the share price. The so-called Greeks measure its sensitivity to different factors. The figures in the table are indicative and relate to a call with about six months to expiry.
| Measure | What it measures | Indicative value | What it means in practice |
|---|
| Delta | Sensitivity to the underlying price | 0.50 | A €1 rise in the share price increases the call by about €0.50 |
| Gamma | Rate of change in Delta | 0.04 | After a €1 rise, Delta becomes about 0.54 |
| Theta | Time decay | −€0.05 per day | Over 10 days, all else being equal, the call loses about €0.50 |
| Vega | Sensitivity to volatility | €0.12 | A 2-point increase in volatility raises the call by about €0.24 |
| Rho | Sensitivity to interest rates | €0.03 | A 1-point increase in interest rates raises the call by about €0.03 |
The takeaway for option buyers is that time works against them (Theta), while the seller earns this time decay in return for taking on the risk of a large move (Gamma).
Swaps: exchanging cash flows
A swap is an agreement to exchange future cash flows on predetermined terms. It is traded mainly over the counter, between banks, companies and institutional investors. The three main types are interest rate swaps, currency swaps and credit default swaps.
Example 9: Interest rate swap, fixing borrowing costs
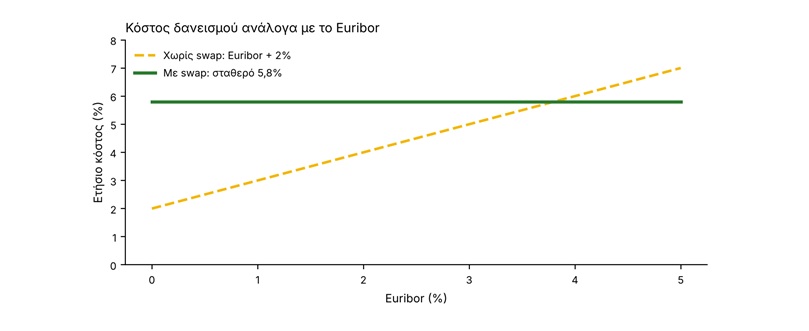
Scenario: A company has a €10 million loan at Euribor + 2% and is concerned about rising interest rates. It enters into a swap under which it pays a fixed 3.8% and receives Euribor.
| Euribor | Loan interest (Euribor + 2%) | Net swap result | Total cost |
|---|
| 1% | €300,000 | −€280,000 | €580,000 |
| 2% | €400,000 | −€180,000 | €580,000 |
| 4% | €600,000 | +€20,000 | €580,000 |
In every scenario, the annual cost is 5.8% (a 2% margin plus a fixed 3.8%), or €580,000. The loan remains floating-rate, but the swap effectively “converts” the cost to a fixed rate. There is a trade-off, however: if Euribor falls to 1%, the company does not benefit and remains at 5.8%, whereas without the swap it would pay 3%.
Example 10: Currency swap for a multinational
Scenario: A European company needs $11 million for its US subsidiary and borrows in euros. At a spot exchange rate of 1.10, it exchanges €10 million for $11 million with a US group that needs euros for its European operations.
During the swap, the company pays interest in dollars, hypothetically 5% or $550,000 a year, and receives interest in euros, hypothetically 3% or €300,000, which covers its euro-denominated debt. At maturity, the principal amounts are returned at the same agreed exchange rate of 1.10. The value of the swap can be seen by comparing it with what would have happened if the company had needed to buy euros in the market again.
| Exchange rate at maturity | € equivalent of $11 million at market rates | With swap | Shortfall at market rates (against €10 million) |
|---|
| 1.00 | €11,000,000 | €10,000,000 | None |
| 1.10 | €10,000,000 | €10,000,000 | None |
| 1.25 | €8,800,000 | €10,000,000 | €1,200,000 |
Exchange-rate movements no longer affect the principal. The company gains access to foreign currency without exposure to exchange-rate risk on the principal, which is why the instrument is widely used by multinationals and public-sector bodies.
Example 11: Credit default swap, insurance against default
Scenario: A fund holds a €10 million bond and buys a CDS with a spread of 150 basis points (1.5%) a year. The recovery rate in the event of default is assumed to be 40%.
- No credit event: the fund pays €150,000 a year, or €750,000 over five years, and receives nothing. This is the premium.
- Default in the third year: the fund has paid €450,000. The protection seller covers the loss on the bond: 10,000,000 × (1 − 40%) = €6,000,000. The net loss is limited to the premiums.
CDSs are also used to speculate on issuers’ creditworthiness without holding the bond. The risk lies with the protection seller. During the 2008 financial crisis, AIG’s collapse was linked to the huge CDS liabilities it had taken on as a protection seller, mainly on mortgage-backed bonds.
Risks: leverage magnifies losses as well
A small initial investment can control a large notional value, and this works both ways, as Example 3 showed. OTC contracts also carry counterparty risk, while even experts find complex products difficult to value. In times of crisis, liquidity disappears precisely when it is needed.
- Barings Bank (1995): speculative positions in Nikkei futures taken by Nick Leeson led to the bank’s collapse.
- LTCM (1998): excessive leverage in fixed-income derivatives threatened financial stability.
- Lehman Brothers and AIG (2008): extensive exposure to CDSs and structured derivatives exacerbated the global crisis.
The Greek market
Futures and options on the FTSE/Athex Large Cap index, as well as single-stock futures, trade on the Derivatives Market of Euronext Athens. Example 2 illustrates their main use by institutional investors: hedging portfolios of Greek shares. Active investors also use them to speculate.
Which instrument for which objective?
| Objective | Instrument / strategy | What we risk | From our examples |
|---|
| Locking in an exchange rate or price | Forward | Counterparty risk; we give up a favourable outcome | Fixed cost of €1,818,182 |
| Portfolio hedging | Index futures | We give up gains from a rise; margin calls | 1,300 contracts, net result €0 |
| Insuring an existing position | Protective put | The premium | Maximum loss of €7,000 |
| Generating income from an existing position | Covered call | Upside is capped above the strike | +€800 premium, maximum €2,800 |
| Betting on a large move | Long straddle | The premium if the share price remains flat | Maximum loss of €5.50 per share |
| Measured bullish view | Bull call spread | We give up gains beyond the higher strike | Loss of €4, gain of up to €16 |
| Fixed borrowing costs | Interest rate swap | Opportunity cost if interest rates fall | Fixed at 5.8%, or €580,000 |
| Hedging credit risk | Credit default swap | The premium | €150,000 a year |
In short, derivatives are:
- Tools, not an end in themselves: derivatives are used to manage risk, and their use should serve a specific investment or business purpose.
- Understand them before using them: leverage magnifies gains and losses. Before taking any position, we should calculate the payoff in every scenario, as shown in the tables above.
- Applied strategically: the choice between hedging, generating income and speculation depends on the objective and on risk tolerance.
* Director of Research at Solidus Securities AEPEY, he leads portfolio analysis and asset-allocation optimisation, developing comprehensive financial models to assess risk and forecast market trends. President of EE PAMA - HACSA.
** This article is for informational and educational purposes and does not constitute investment, tax or legal advice. The figures are indicative, based on publicly available historical data, and do not guarantee future returns. Before making any investment decision, consult a certified investment adviser.